Price / Percentage change:
| Open | High | Low | Close |
| Latest | 689.45 | 697.80 | 680.20 | 681.50 |
| Prev day | 679.75 | 698.80 | 678.00 | 689.50 |
| Last week | 645.00 | 664.80 | 632.65 | 638.20 |
| Last month | 640.00 | 689.00 | 596.00 | 620.45 |
| All time | | 1024.55 | 41.30 | |
| 1 Day | 5 Day | 20 Day | 50 Day |
| -1.00% | 6.50% | 11.50% | 16.00% |
Trading range:
| TradingRange | Highest
Close | Lowest
Close | Highest
High | Lowest
Low |
| 5 days | 689.50 | 673.10 | 698.80 | 640.95 |
| 10 days | 689.50 | 638.20 | 698.80 | 632.65 |
| 20 days | 689.50 | 616.50 | 707.00 | 608.00 |
Technical levels / commentary unreliable for this stock due to low volumes/ poor liquidity
Trend analysis :
| Trend | First Signal | Price | Reversal | P SAR |
| SSS | 13-03-2024 | 603.65 | 707.00 | 699.89 |
| ATR (20d) | Williams R | RSI (5d) | RSI (14d) | Vol | Av Vol (20d) |
| 21.07 | 66 | 62 | 61 | 30000 | 56000
|
Fibonacci price projections:
| 0% | 61.8% | 100% | 161.8% | 261.8% |
| Up | 632.65 | 678.60 | 707.00 | 752.95 | 827.30 |
| Dn | 707.00 | 661.05 | 632.65 | 586.70 | 512.35 |
Intraday pivot levels:
| Sup 2 | Sup 1 | Pivot | Res 1 | Res 2 |
| 668.90 | 675.20 | 686.50 | 692.80 | 704.05 |
Weekly pivot levels:
| Sup 2 | Sup 1 | Pivot | Res 1 | Res 2 |
| 613.05 | 625.60 | 645.20 | 657.75 | 677.35 |
Monthly pivot levels:
| Sup 2 | Sup 1 | Pivot | Res 1 | Res 2 |
| 542.15 | 581.30 | 635.15 | 674.30 | 728.15 |
Moving averages (simple):
| 5 Day | 20 Day | 50 Day | 200 Day |
| 681 | 655 | 646 |
625 |
Other levels:
| 52 Week Hi - Lo | Last Mnth Hi - Lo | Swing Hi - Lo | B Band Hi - Lo |
| 775.45 - 563.90 | 689.00 - 596.00 | 707.00 - 632.65 | 697.36 - 612.67 |
|
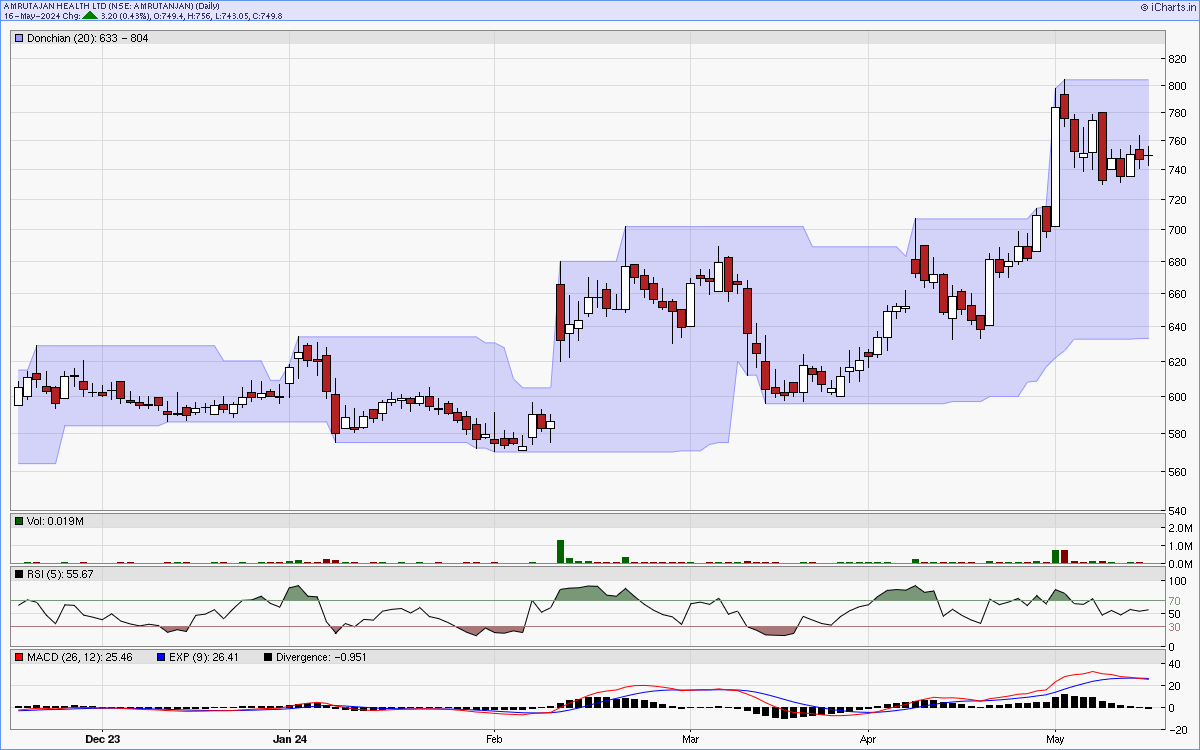
Charts...
Six months candlestick chart
Charts courtsey: iCharts.in
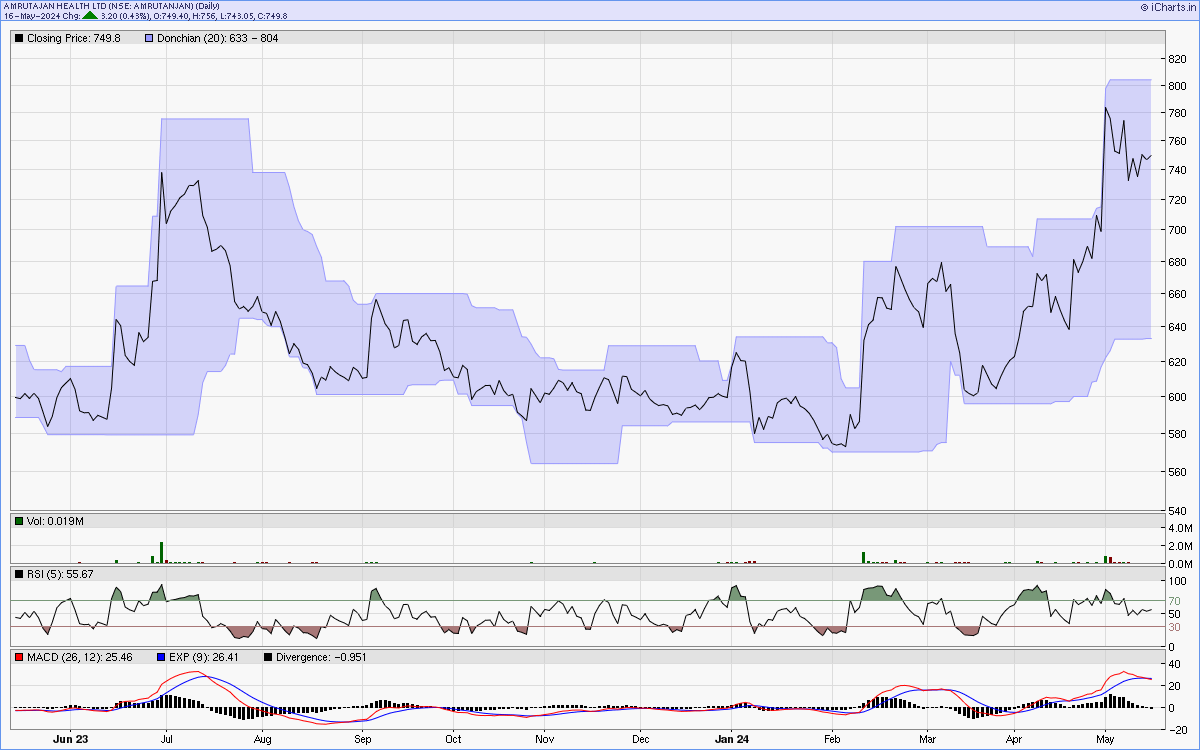
One year line chart
Two years weekly chart
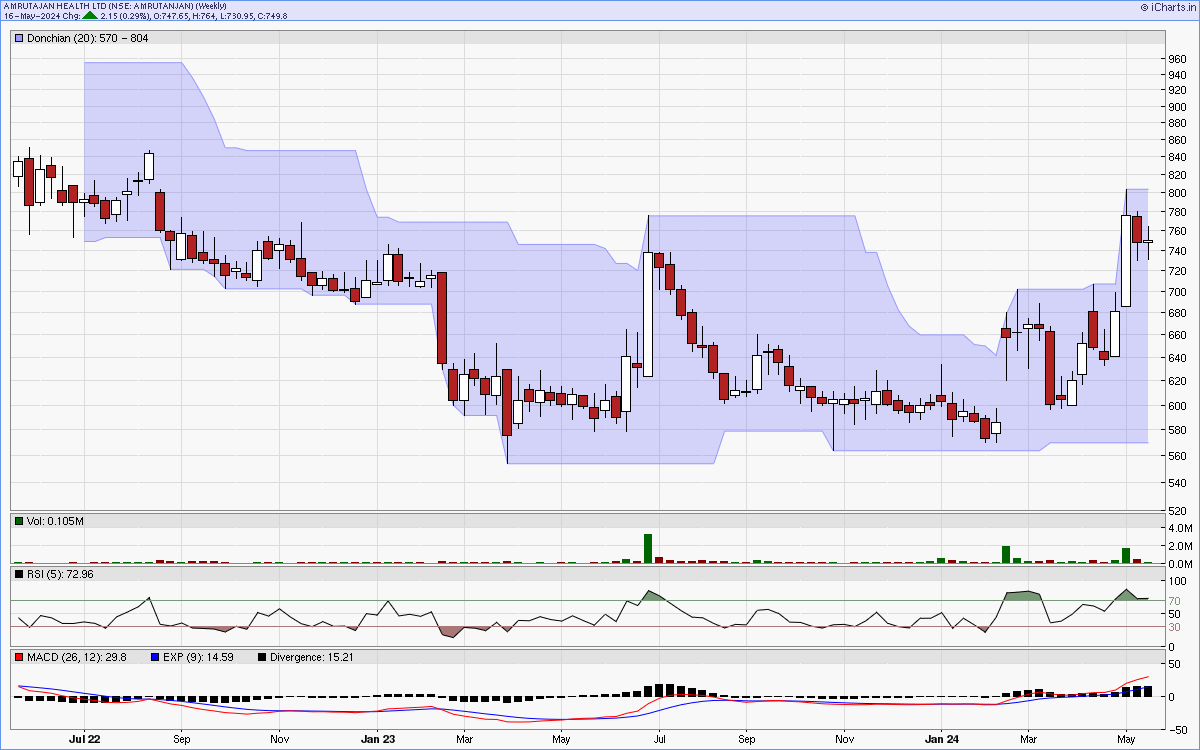
Charts courtsey: iCharts.in