Price / Percentage change:
| Open | High | Low | Close |
| Latest | 505.70 | 551.10 | 500.55 | 535.40 |
| Prev day | 496.00 | 512.00 | 496.00 | 506.05 |
| Last week | 487.20 | 499.95 | 471.65 | 488.40 |
| Last month | 549.90 | 590.70 | 470.00 | 475.70 |
| All time | | 721.80 | 71.57 | |
| 1 Day | 5 Day | 20 Day | 50 Day |
| 5.50% | 9.50% | 8.00% | -5.50% |
Trading range:
| TradingRange | Highest
Close | Lowest
Close | Highest
High | Lowest
Low |
| 5 days | 535.40 | 488.40 | 551.10 | 476.00 |
| 10 days | 535.40 | 478.95 | 551.10 | 471.65 |
| 20 days | 535.40 | 475.70 | 551.10 | 471.65 |
Trend analysis :
| Trend | First Signal | Price | Reversal | P SAR |
| BBB | 25-04-2024 | 535.40 | 471.65 | 470.00 |
| ATR (20d) | Williams R | RSI (5d) | RSI (14d) | Vol | Av Vol (20d) |
| 21.18 | 80 | 89 | 64 | 725000 | 156000
|
Today was a high volume day...
Fibonacci price projections:
| 0% | 61.8% | 100% | 161.8% | 261.8% |
| Up | 471.65 | 500.26 | 517.95 | 546.56 | 592.86 |
| Dn | 517.95 | 489.34 | 471.65 | 443.04 | 396.74 |
Intraday pivot levels:
| Sup 2 | Sup 1 | Pivot | Res 1 | Res 2 |
| 478.45 | 506.90 | 529.00 | 557.45 | 579.55 |
Weekly pivot levels:
| Sup 2 | Sup 1 | Pivot | Res 1 | Res 2 |
| 458.35 | 473.35 | 486.65 | 501.65 | 514.95 |
Monthly pivot levels:
| Sup 2 | Sup 1 | Pivot | Res 1 | Res 2 |
| 391.40 | 433.50 | 512.10 | 554.20 | 632.80 |
Moving averages (simple):
| 5 Day | 20 Day | 50 Day | 200 Day |
| 504 | 497 | 519 |
533 |
Other levels:
| 52 Week Hi - Lo | Last Mnth Hi - Lo | Swing Hi - Lo | B Band Hi - Lo |
| 693.00 - 325.00 | 590.70 - 470.00 | 517.95 - 471.65 | 523.80 - 469.84 |
|
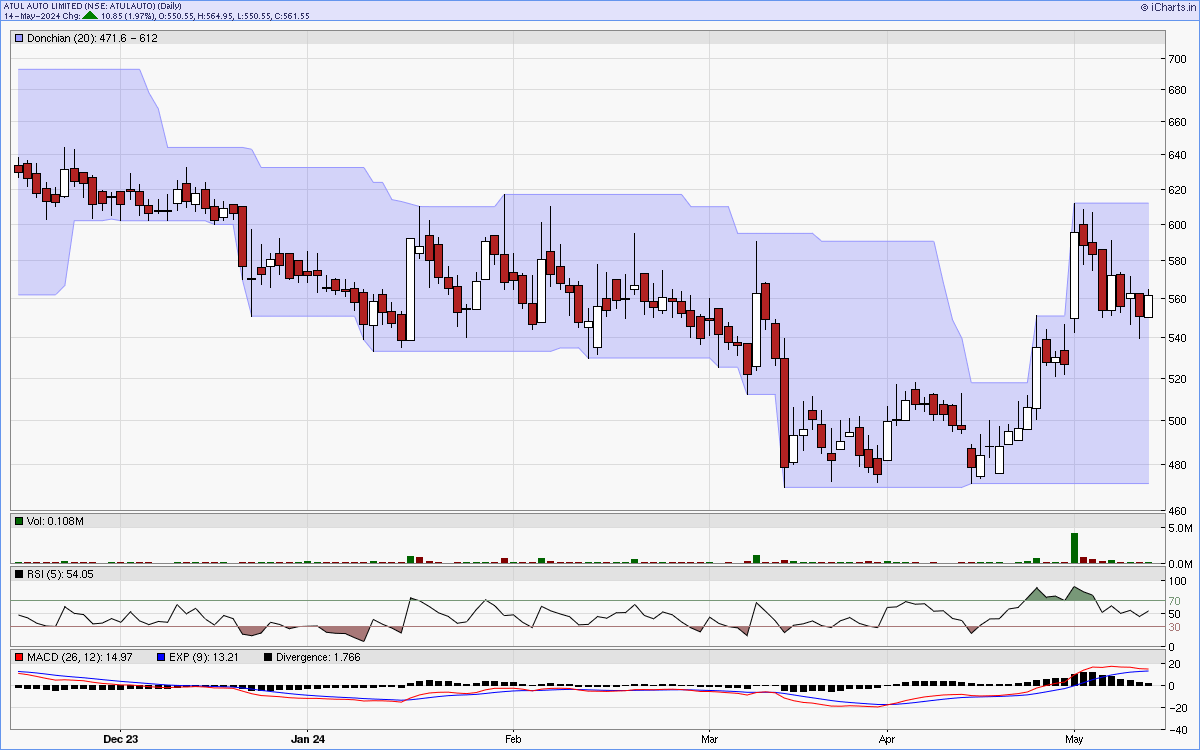
Charts...
Six months candlestick chart
Charts courtsey: iCharts.in
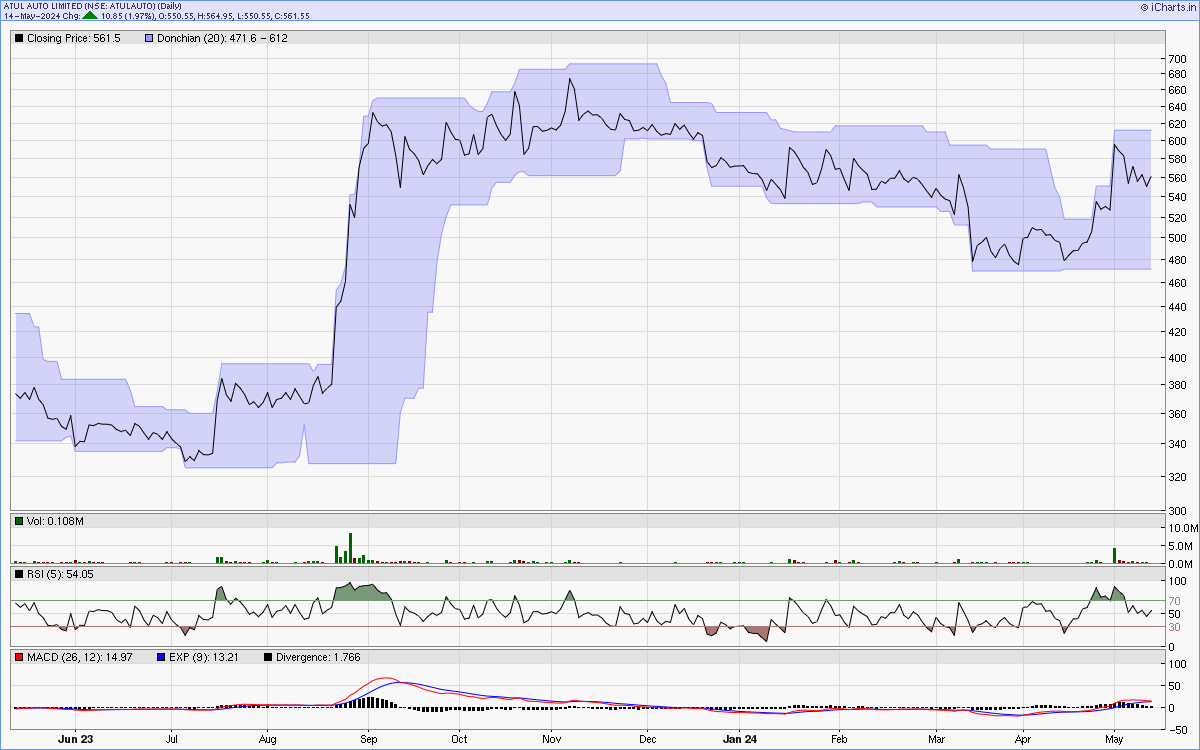
One year line chart
Two years weekly chart
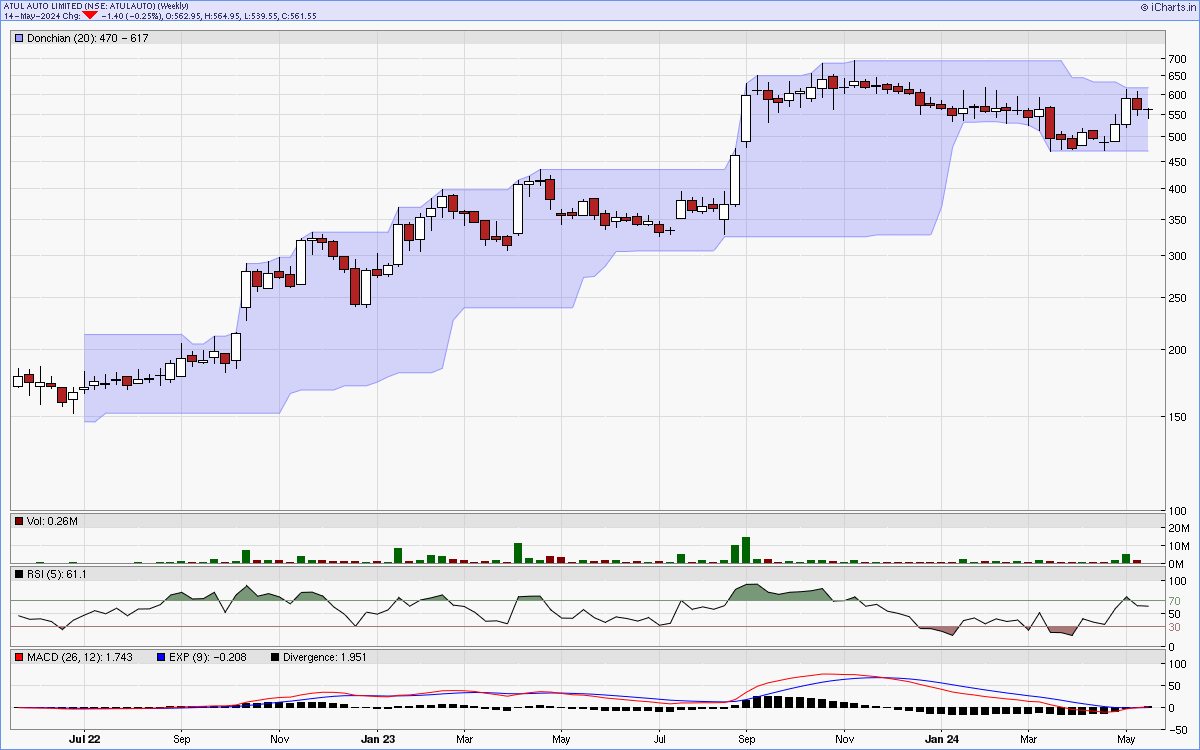
Charts courtsey: iCharts.in