Price / Percentage change:
| Open | High | Low | Close |
| Latest | 1109.00 | 1109.00 | 1079.00 | 1087.05 |
| Prev day | 1113.85 | 1129.00 | 1095.80 | 1114.50 |
| Last week | 1129.90 | 1137.25 | 1086.00 | 1088.45 |
| Last month | 1020.60 | 1114.00 | 984.30 | 1088.75 |
| All time | | 1177.10 | 6.80 | |
| 1 Day | 5 Day | 20 Day | 50 Day |
| -2.00% | -1.50% | 6.50% | 1.50% |
Trading range:
| TradingRange | Highest
Close | Lowest
Close | Highest
High | Lowest
Low |
| 5 days | 1114.50 | 1085.30 | 1129.00 | 1069.30 |
| 10 days | 1131.95 | 1085.30 | 1142.00 | 1069.30 |
| 20 days | 1137.65 | 990.40 | 1150.70 | 986.20 |
Trend analysis :
| Trend | First Signal | Price | Reversal | P SAR |
| BBB | 04-03-2024 | 1090.90 | 986.20 | 1068.43 |
| ATR (20d) | Williams R | RSI (5d) | RSI (14d) | Vol | Av Vol (20d) |
| 34.50 | 27 | 39 | 51 | 1304000 | 1747000
|
Fibonacci price projections:
| 0% | 61.8% | 100% | 161.8% | 261.8% |
| Up | 984.30 | 1087.14 | 1150.70 | 1253.54 | 1419.94 |
| Dn | 1150.70 | 1047.86 | 984.30 | 881.46 | 715.06 |
Intraday pivot levels:
| Sup 2 | Sup 1 | Pivot | Res 1 | Res 2 |
| 1061.65 | 1074.30 | 1091.65 | 1104.30 | 1121.65 |
Weekly pivot levels:
| Sup 2 | Sup 1 | Pivot | Res 1 | Res 2 |
| 1052.60 | 1070.40 | 1103.85 | 1121.65 | 1155.10 |
Monthly pivot levels:
| Sup 2 | Sup 1 | Pivot | Res 1 | Res 2 |
| 932.60 | 1010.65 | 1062.35 | 1140.35 | 1192.05 |
Moving averages (simple):
| 5 Day | 20 Day | 50 Day | 200 Day |
| 1097 | 1086 | 1053 |
959 |
Other levels:
| 52 Week Hi - Lo | Last Mnth Hi - Lo | Swing Hi - Lo | B Band Hi - Lo |
| 1177.10 - 581.25 | 1114.00 - 984.30 | 1150.70 - 984.30 | 1168.99 - 1002.50 |
|
Charts...
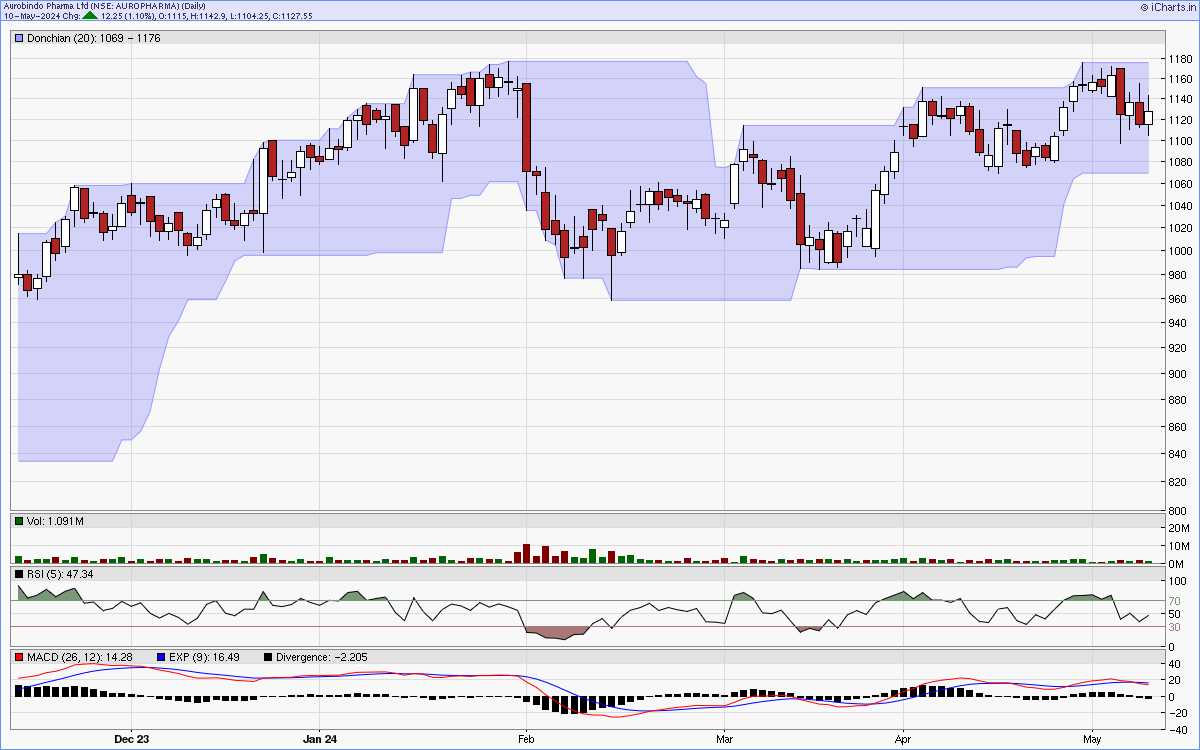
Six months candlestick chart
Charts courtsey: iCharts.in
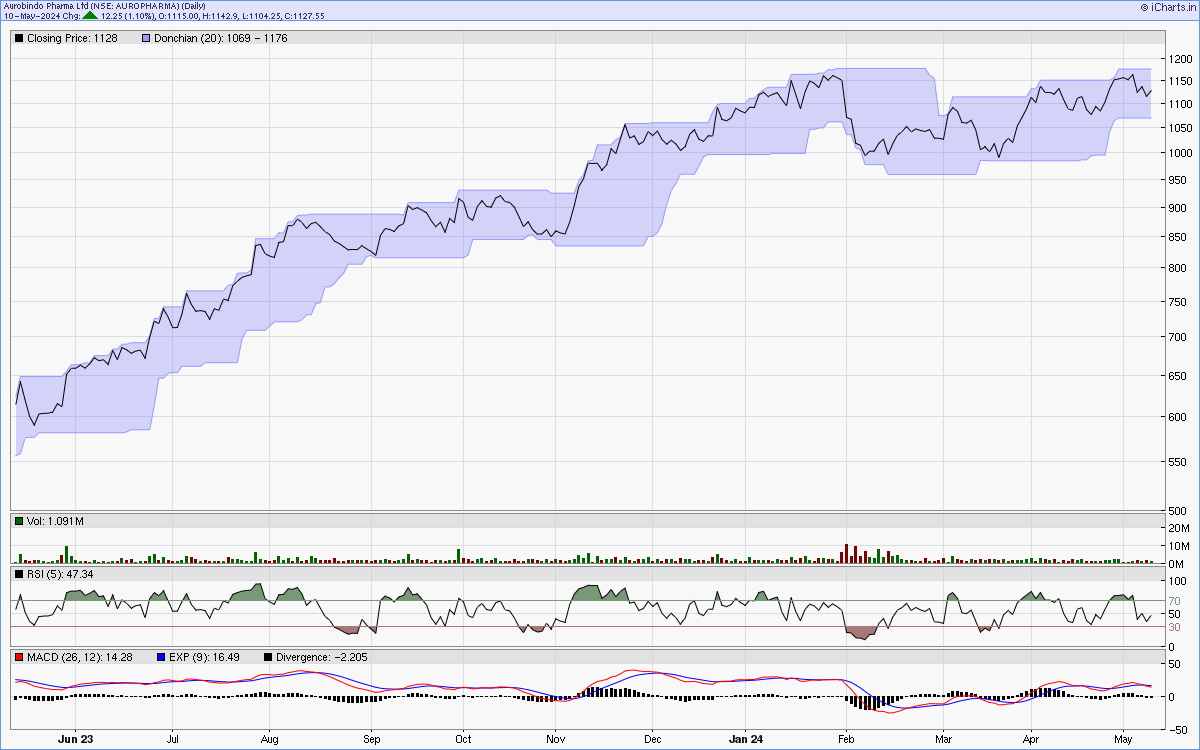
One year line chart
Two years weekly chart
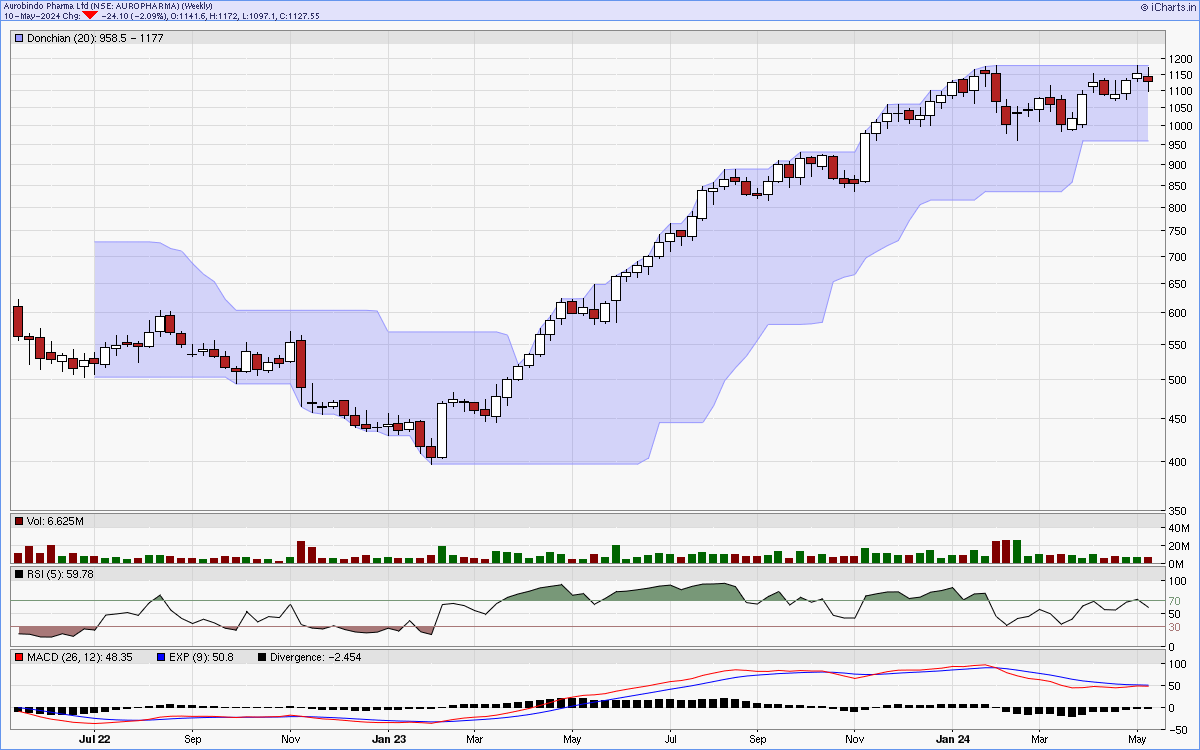
Charts courtsey: iCharts.in