Price / Percentage change:
| Open | High | Low | Close |
| Latest | 711.00 | 720.50 | 695.00 | 698.40 |
| Prev day | 701.05 | 712.90 | 695.25 | 708.10 |
| Last week | 756.00 | 756.00 | 725.80 | 732.30 |
| Last month | 781.00 | 794.00 | 712.45 | 742.00 |
| All time | | 861.85 | 46.70 | |
| 1 Day | 5 Day | 20 Day | 50 Day |
| -1.00% | -4.00% | -7.50% | -15.50% |
Trading range:
| TradingRange | Highest
Close | Lowest
Close | Highest
High | Lowest
Low |
| 5 days | 738.80 | 698.40 | 750.80 | 695.00 |
| 10 days | 779.30 | 698.40 | 789.90 | 695.00 |
| 20 days | 779.30 | 698.40 | 789.90 | 695.00 |
Trend analysis :
| Trend | First Signal | Price | Reversal | P SAR |
| SSS | 26-02-2024 | 779.05 | 789.90 | 776.58 |
| ATR (20d) | Williams R | RSI (5d) | RSI (14d) | Vol | Av Vol (20d) |
| 25.56 | 4 | 21 | 36 | 1730000 | 1385000
|
Fibonacci price projections:
| 0% | 61.8% | 100% | 161.8% | 261.8% |
| Up | 712.45 | 760.31 | 789.90 | 837.76 | 915.21 |
| Dn | 789.90 | 742.04 | 712.45 | 664.59 | 587.14 |
Intraday pivot levels:
| Sup 2 | Sup 1 | Pivot | Res 1 | Res 2 |
| 679.10 | 688.70 | 704.60 | 714.20 | 730.10 |
Weekly pivot levels:
| Sup 2 | Sup 1 | Pivot | Res 1 | Res 2 |
| 707.80 | 720.00 | 738.00 | 750.20 | 768.20 |
Monthly pivot levels:
| Sup 2 | Sup 1 | Pivot | Res 1 | Res 2 |
| 667.90 | 704.90 | 749.45 | 786.45 | 831.00 |
Moving averages (simple):
| 5 Day | 20 Day | 50 Day | 200 Day |
| 717 | 738 | 776 |
613 |
Other levels:
| 52 Week Hi - Lo | Last Mnth Hi - Lo | Swing Hi - Lo | B Band Hi - Lo |
| 861.85 - 255.45 | 794.00 - 712.45 | 789.90 - 712.45 | 782.45 - 693.92 |
|
Charts...
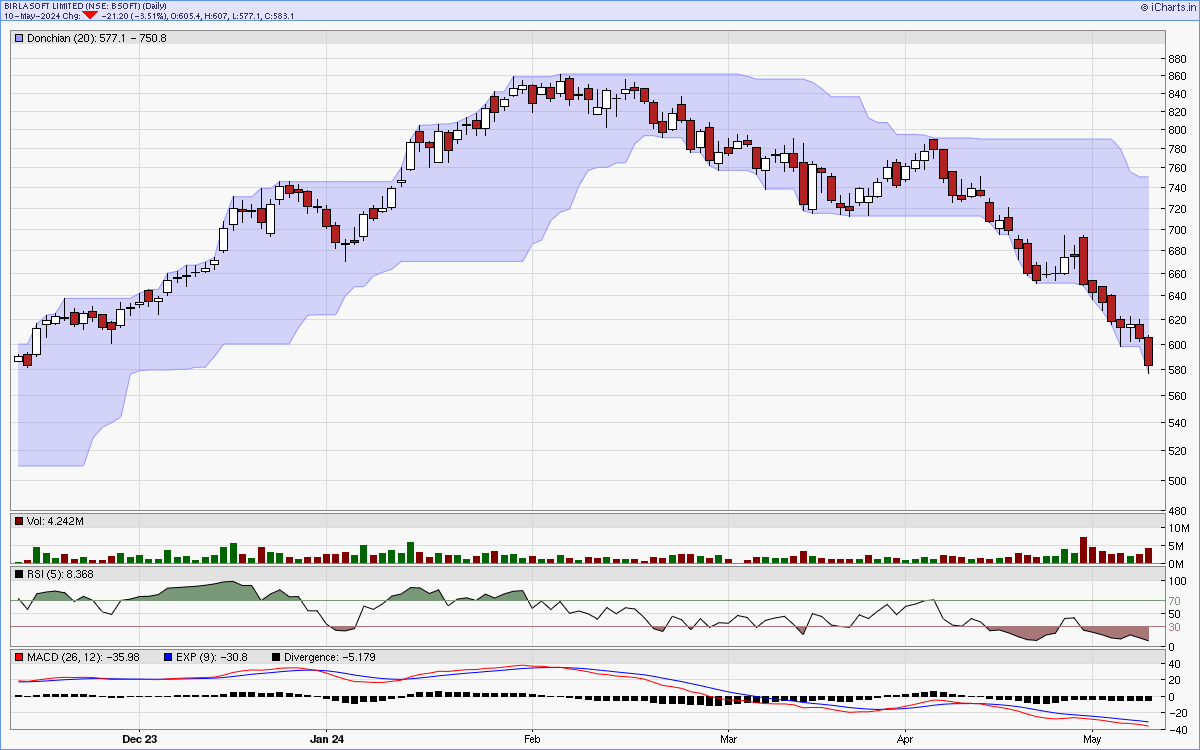
Six months candlestick chart
Charts courtsey: iCharts.in
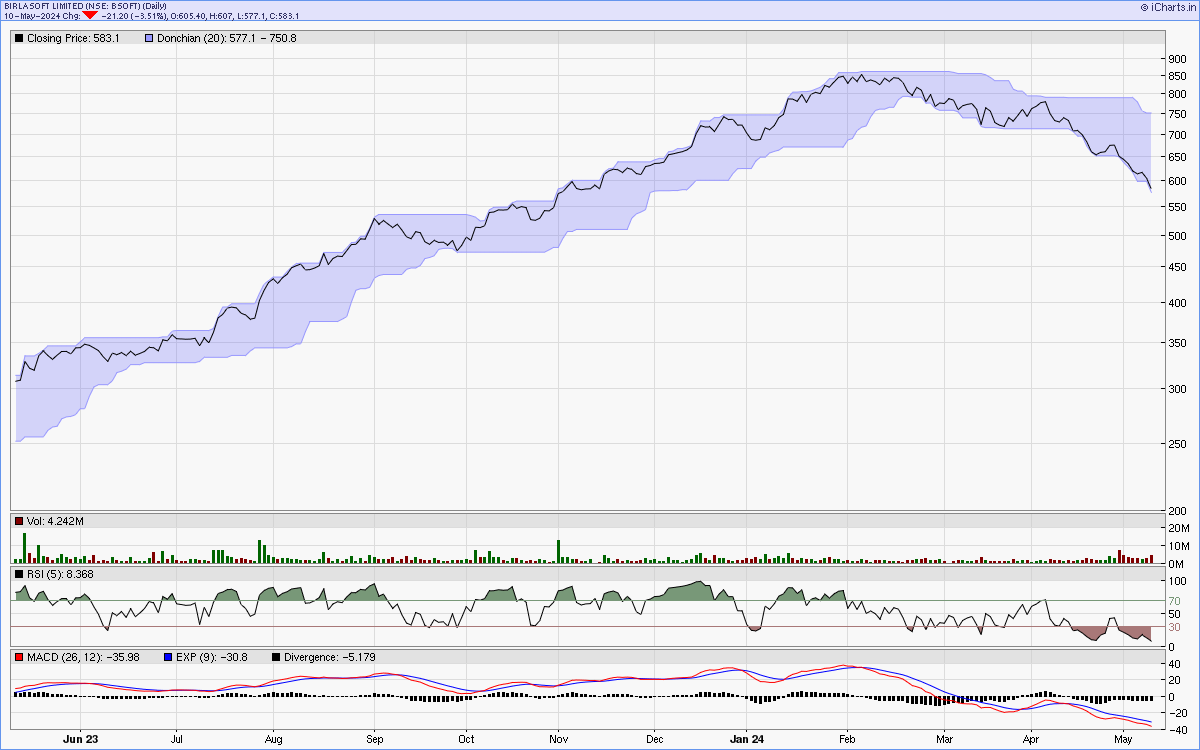
One year line chart
Two years weekly chart
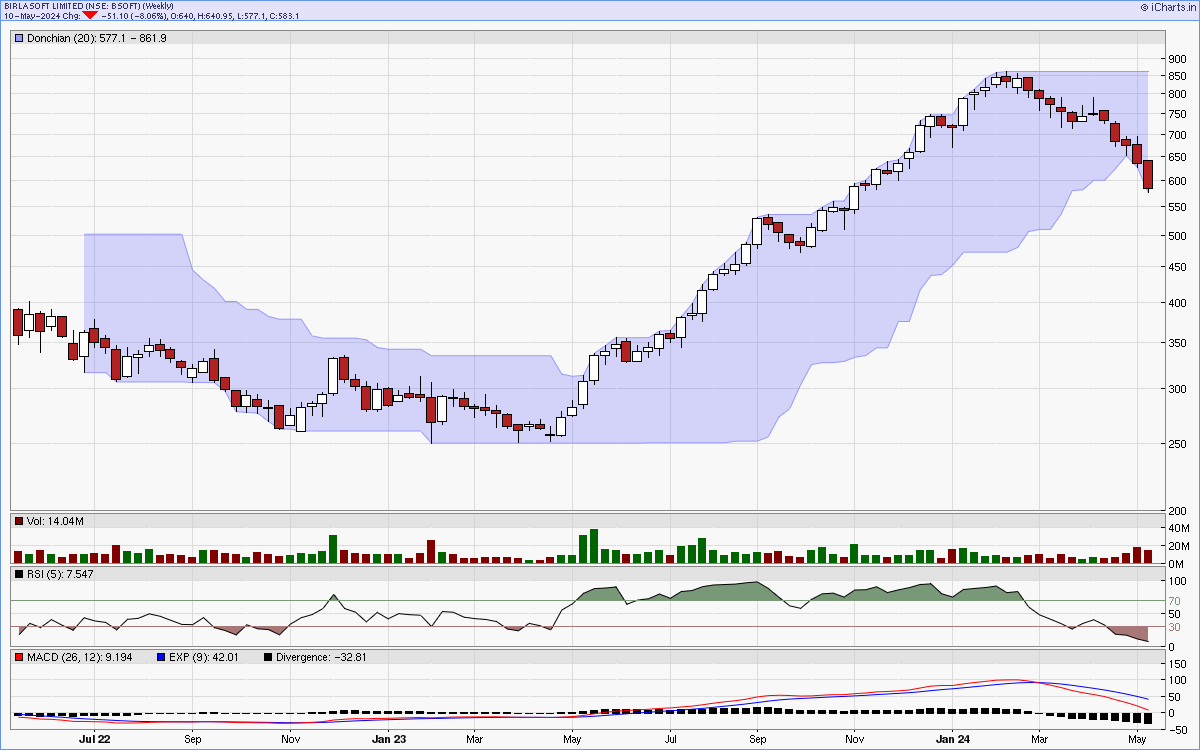
Charts courtsey: iCharts.in