Price / Percentage change:
| Open | High | Low | Close |
| Latest | 1137.05 | 1152.95 | 1116.55 | 1119.90 |
| Prev day | 1131.40 | 1141.30 | 1120.00 | 1137.05 |
| Last week | 1165.00 | 1179.45 | 1141.60 | 1155.20 |
| Last month | 1081.90 | 1130.10 | 1036.75 | 1075.05 |
| All time | | 1271.55 | 97.50 | |
| 1 Day | 5 Day | 20 Day | 50 Day |
| -1.50% | -2.00% | 4.00% | 4.50% |
Trading range:
| TradingRange | Highest
Close | Lowest
Close | Highest
High | Lowest
Low |
| 5 days | 1163.70 | 1119.90 | 1179.45 | 1116.55 |
| 10 days | 1163.70 | 1119.90 | 1179.45 | 1116.55 |
| 20 days | 1163.70 | 1054.15 | 1179.45 | 1036.75 |
Trend analysis :
| Trend | First Signal | Price | Reversal | P SAR |
| BBB | 02-04-2024 | 1133.30 | 1036.75 | 1178.26 |
| ATR (20d) | Williams R | RSI (5d) | RSI (14d) | Vol | Av Vol (20d) |
| 28.40 | 50 | 34 | 51 | 531000 | 424000
|
Fibonacci price projections:
| 0% | 61.8% | 100% | 161.8% | 261.8% |
| Up | 1036.75 | 1124.94 | 1179.45 | 1267.64 | 1410.34 |
| Dn | 1179.45 | 1091.26 | 1036.75 | 948.56 | 805.86 |
Intraday pivot levels:
| Sup 2 | Sup 1 | Pivot | Res 1 | Res 2 |
| 1093.35 | 1106.60 | 1129.80 | 1143.05 | 1166.20 |
Weekly pivot levels:
| Sup 2 | Sup 1 | Pivot | Res 1 | Res 2 |
| 1120.85 | 1138.05 | 1158.75 | 1175.90 | 1196.60 |
Monthly pivot levels:
| Sup 2 | Sup 1 | Pivot | Res 1 | Res 2 |
| 987.25 | 1031.10 | 1080.60 | 1124.40 | 1173.90 |
Moving averages (simple):
| 5 Day | 20 Day | 50 Day | 200 Day |
| 1142 | 1112 | 1097 |
1106 |
Other levels:
| 52 Week Hi - Lo | Last Mnth Hi - Lo | Swing Hi - Lo | B Band Hi - Lo |
| 1271.55 - 908.10 | 1130.10 - 1036.75 | 1179.45 - 1036.75 | 1191.52 - 1031.57 |
|
Charts...
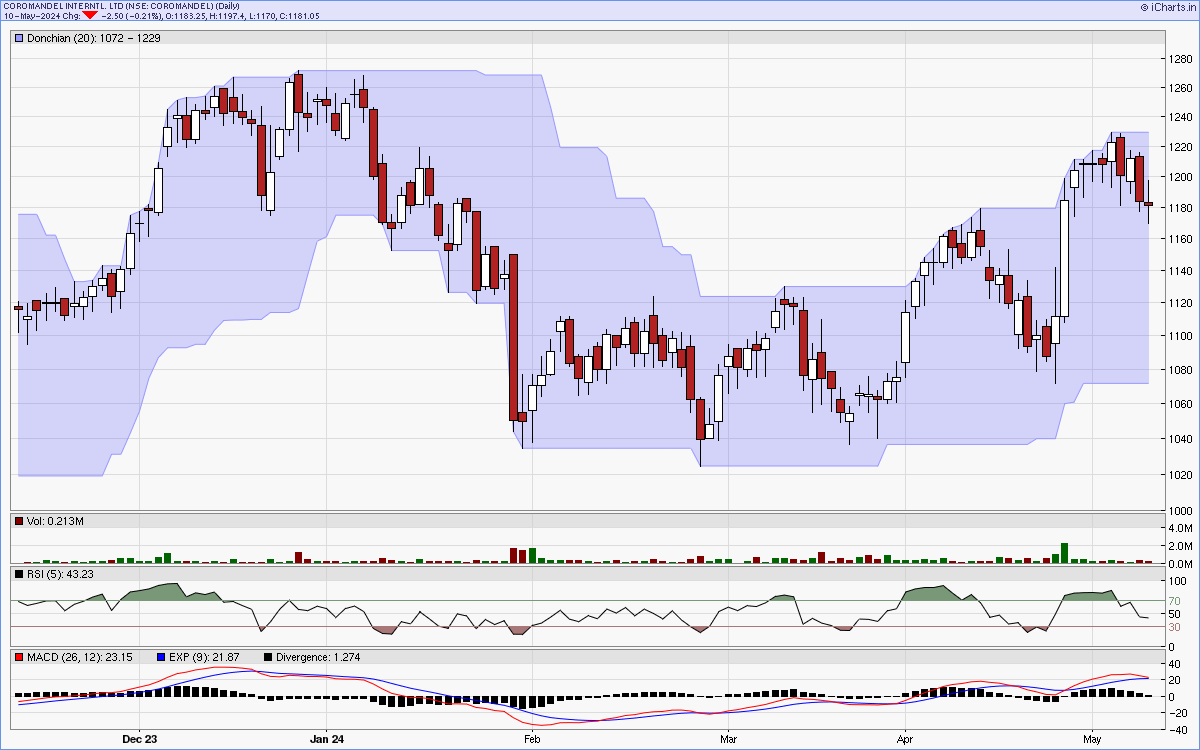
Six months candlestick chart
Charts courtsey: iCharts.in
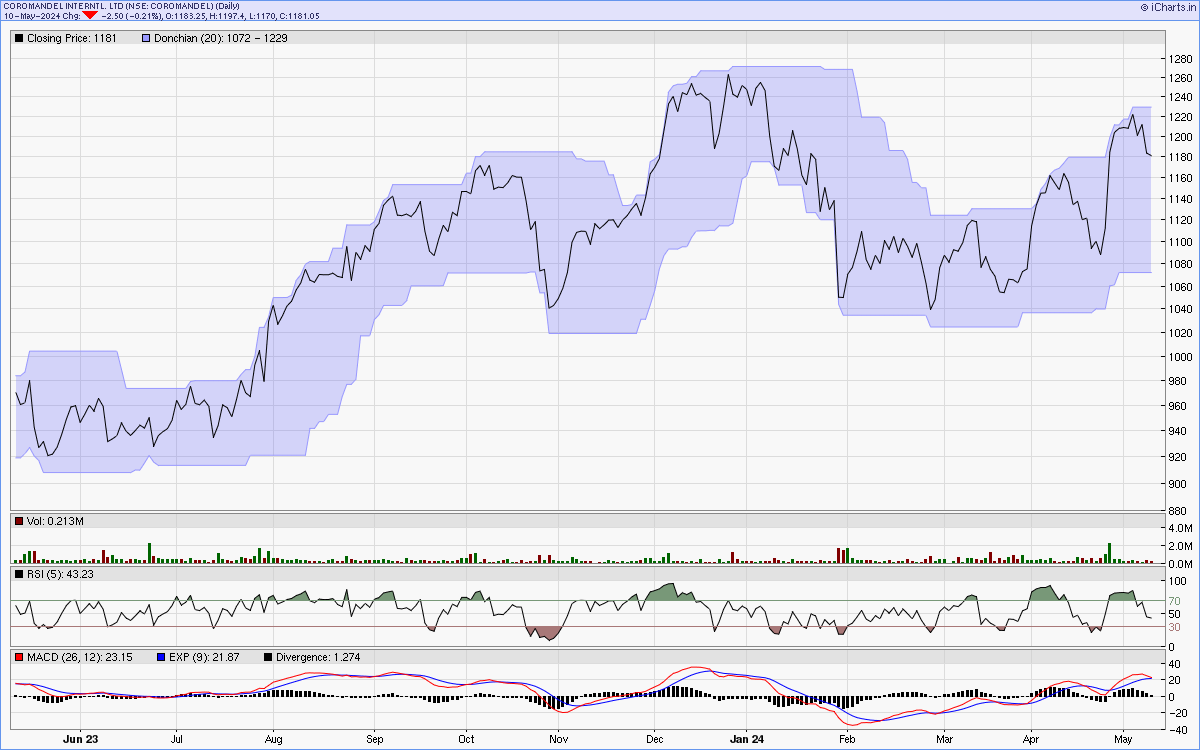
One year line chart
Two years weekly chart
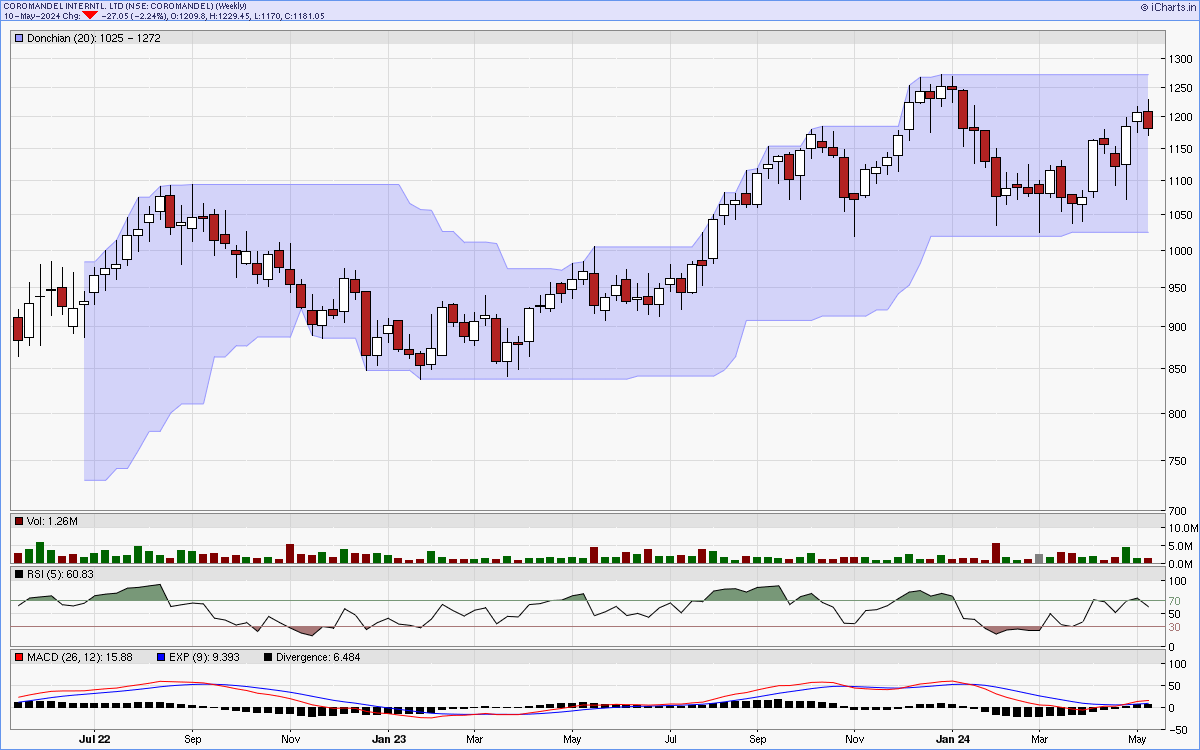
Charts courtsey: iCharts.in