Price / Percentage change:
| Open | High | Low | Close |
| Latest | 825.00 | 848.80 | 820.05 | 824.70 |
| Prev day | 850.00 | 862.55 | 801.75 | 830.65 |
| Last week | 795.00 | 844.95 | 775.00 | 819.30 |
| Last month | 696.10 | 739.00 | 610.00 | 679.60 |
| All time | | 1355.60 | 121.00 | |
| 1 Day | 5 Day | 20 Day | 50 Day |
| -0.50% | 0.50% | 22.50% | 4.50% |
Trading range:
| TradingRange | Highest
Close | Lowest
Close | Highest
High | Lowest
Low |
| 5 days | 843.95 | 815.25 | 862.55 | 801.75 |
| 10 days | 843.95 | 769.25 | 862.55 | 730.50 |
| 20 days | 843.95 | 677.60 | 862.55 | 671.20 |
Trend analysis :
| Trend | First Signal | Price | Reversal | P SAR |
| BBB | 03-04-2024 | 742.40 | 671.20 | 767.86 |
| ATR (20d) | Williams R | RSI (5d) | RSI (14d) | Vol | Av Vol (20d) |
| 39.88 | 75 | 61 | 65 | 79000 | 67000
|
Fibonacci price projections:
| 0% | 61.8% | 100% | 161.8% | 261.8% |
| Up | 685.00 | 741.24 | 776.00 | 832.24 | 923.24 |
| Dn | 776.00 | 719.76 | 685.00 | 628.76 | 537.76 |
Intraday pivot levels:
| Sup 2 | Sup 1 | Pivot | Res 1 | Res 2 |
| 802.40 | 813.50 | 831.15 | 842.25 | 859.90 |
Weekly pivot levels:
| Sup 2 | Sup 1 | Pivot | Res 1 | Res 2 |
| 743.05 | 781.10 | 813.05 | 851.10 | 883.00 |
Monthly pivot levels:
| Sup 2 | Sup 1 | Pivot | Res 1 | Res 2 |
| 547.15 | 613.30 | 676.15 | 742.30 | 805.15 |
Moving averages (simple):
| 5 Day | 20 Day | 50 Day | 200 Day |
| 828 | 770 | 735 |
576 |
Other levels:
| 52 Week Hi - Lo | Last Mnth Hi - Lo | Swing Hi - Lo | B Band Hi - Lo |
| 930.00 - 308.65 | 739.00 - 610.00 | 685.00 - 776.00 | 874.38 - 666.11 |
|
Charts...
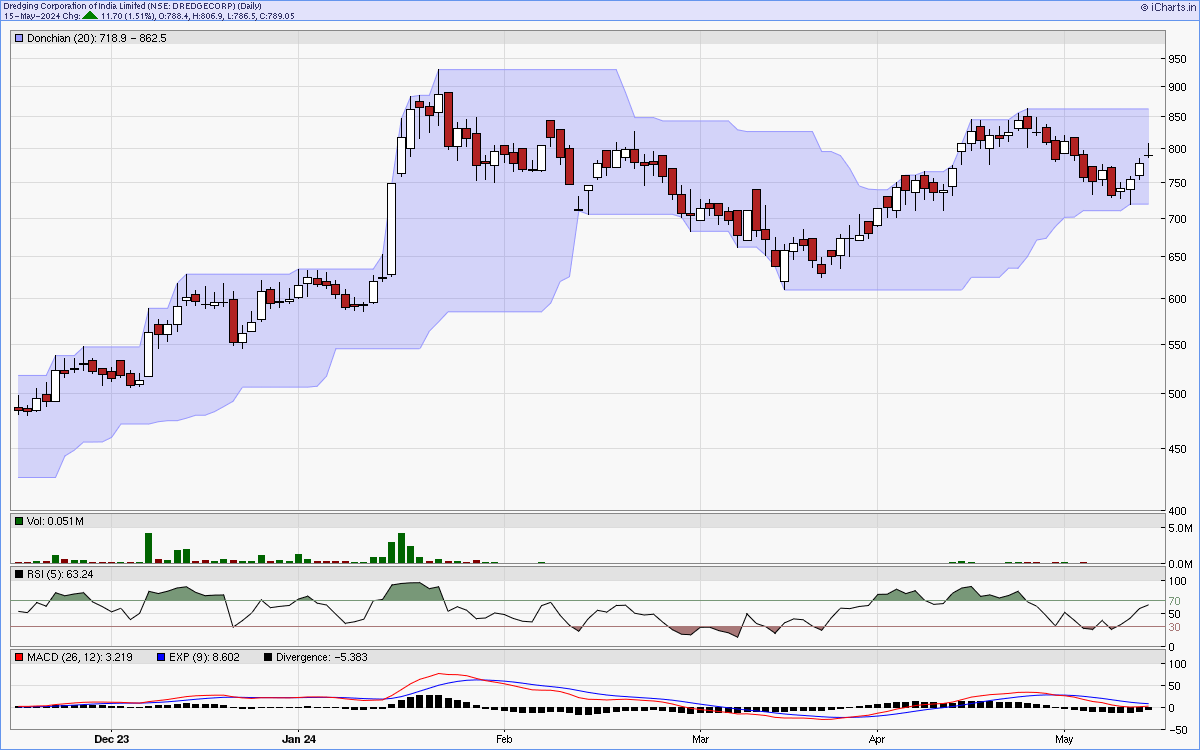
Six months candlestick chart
Charts courtsey: iCharts.in
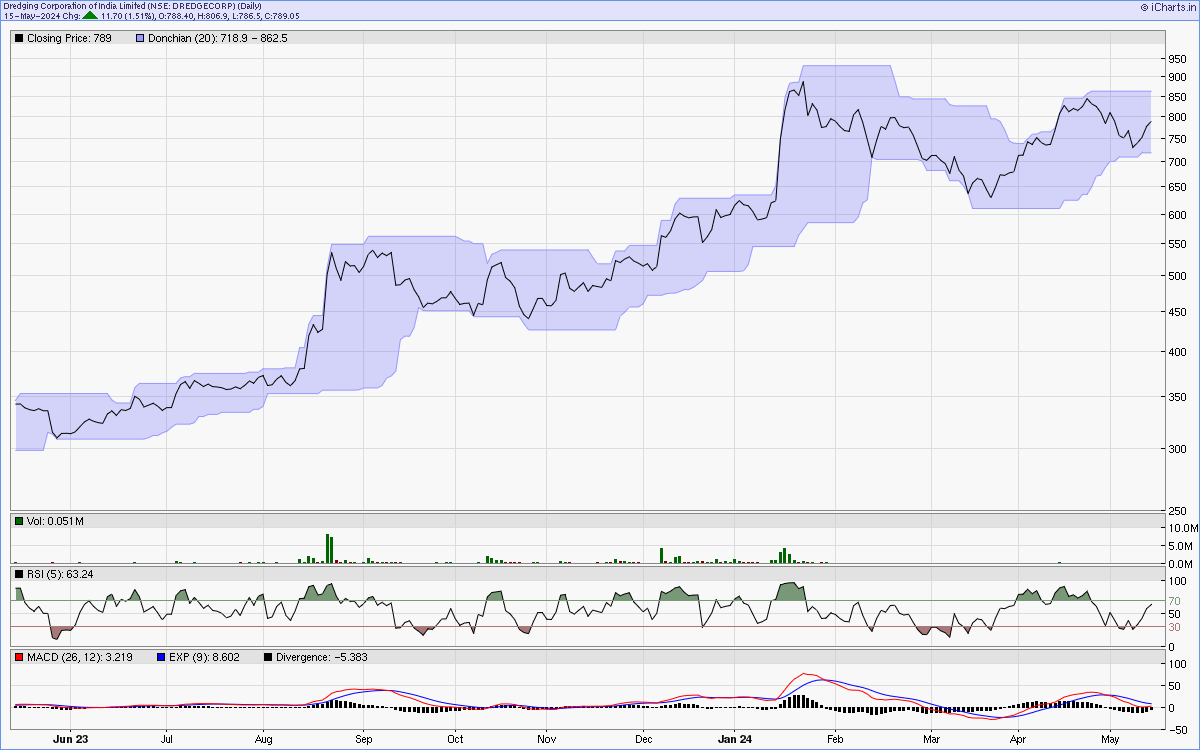
One year line chart
Two years weekly chart
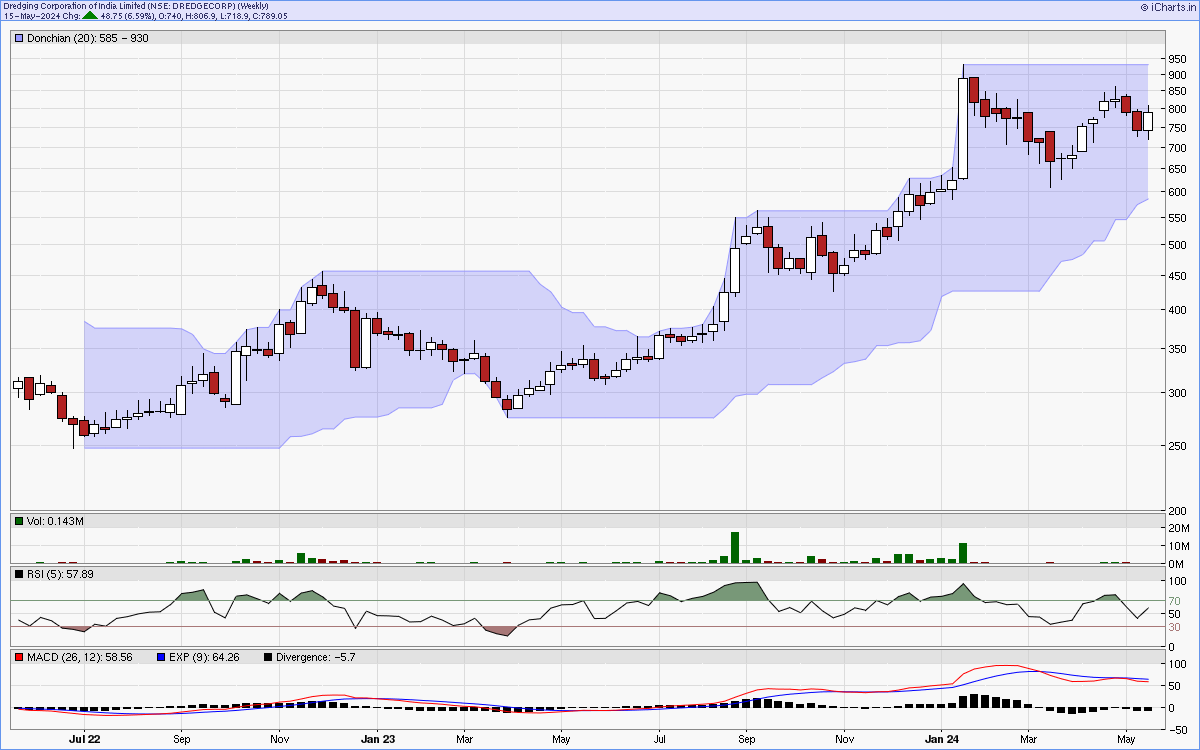
Charts courtsey: iCharts.in