Price / Percentage change:
| Open | High | Low | Close |
| Latest | 119.55 | 125.20 | 118.25 | 120.30 |
| Prev day | 123.00 | 125.65 | 117.10 | 119.60 |
| Last week | 129.00 | 129.85 | 121.35 | 125.00 |
| Last month | 125.00 | 136.75 | 121.00 | 121.70 |
| All time | | 206.25 | 32.50 | |
| 1 Day | 5 Day | 20 Day | 50 Day |
| 0.50% | -5.00% | -8.00% | 12.50% |
Trading range:
| TradingRange | Highest
Close | Lowest
Close | Highest
High | Lowest
Low |
| 5 days | 125.65 | 119.60 | 126.90 | 117.10 |
| 10 days | 127.15 | 119.60 | 129.85 | 117.10 |
| 20 days | 131.95 | 119.60 | 135.00 | 117.10 |
Trend analysis :
| Trend | First Signal | Price | Reversal | P SAR |
| SSS | 01-02-2023 | 119.60 | 135.00 | 127.98 |
| ATR (20d) | Williams R | RSI (5d) | RSI (14d) | Vol | Av Vol (20d) |
| 5.22 | 22 | 26 | 41 | 692000 | 867000
|
Fibonacci price projections:
| 0% | 61.8% | 100% | 161.8% | 261.8% |
| Up | 122.90 | 131.46 | 136.75 | 145.31 | 159.16 |
| Dn | 136.75 | 128.19 | 122.90 | 114.34 | 100.49 |
Intraday pivot levels:
| Sup 2 | Sup 1 | Pivot | Res 1 | Res 2 |
| 114.30 | 117.30 | 121.25 | 124.25 | 128.20 |
Weekly pivot levels:
| Sup 2 | Sup 1 | Pivot | Res 1 | Res 2 |
| 116.90 | 120.95 | 125.40 | 129.45 | 133.90 |
Monthly pivot levels:
| Sup 2 | Sup 1 | Pivot | Res 1 | Res 2 |
| 110.70 | 116.15 | 126.45 | 131.90 | 142.20 |
Moving averages (simple):
| 5 Day | 20 Day | 50 Day | 200 Day |
| 122 | 127 | 124 |
106 |
Other levels:
| 52 Week Hi - Lo | Last Mnth Hi - Lo | Swing Hi - Lo | B Band Hi - Lo |
| 136.75 - 75.00 | 136.75 - 121.00 | 136.75 - 122.90 | 132.88 - 120.35 |
|
Charts...
Six months candlestick chart
Charts courtsey: iCharts.in

One year line chart

Two years weekly chart
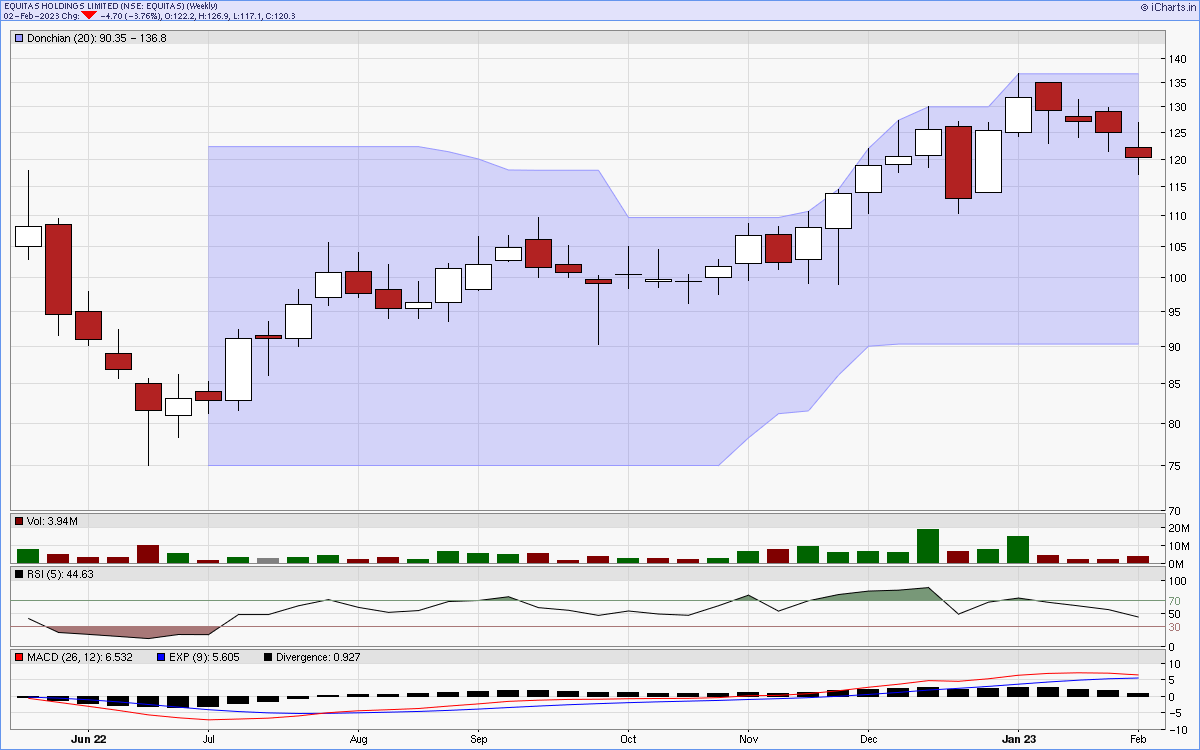
Charts courtsey: iCharts.in