Price / Percentage change:
| Open | High | Low | Close |
| Latest | 1486.55 | 1534.95 | 1480.25 | 1531.30 |
| Prev day | 1509.80 | 1518.85 | 1491.05 | 1494.70 |
| Last week | 1554.95 | 1557.25 | 1513.45 | 1518.95 |
| Last month | 1400.00 | 1471.60 | 1400.00 | 1447.90 |
| All time | | 1757.50 | 77.40 | |
| 1 Day | 5 Day | 20 Day | 50 Day |
| 2.00% | 0.00% | 5.50% | 5.50% |
Trading range:
| TradingRange | Highest
Close | Lowest
Close | Highest
High | Lowest
Low |
| 5 days | 1531.30 | 1494.70 | 1534.95 | 1480.25 |
| 10 days | 1549.55 | 1494.70 | 1557.25 | 1480.25 |
| 20 days | 1549.55 | 1425.40 | 1557.25 | 1421.25 |
Trend analysis :
| Trend | First Signal | Price | Reversal | P SAR |
| BBB | 02-04-2024 | 1480.15 | 1421.25 | 1550.17 |
| ATR (20d) | Williams R | RSI (5d) | RSI (14d) | Vol | Av Vol (20d) |
| 26.05 | 78 | 62 | 61 | 17288000 | 20338000
|
Fibonacci price projections:
| 0% | 61.8% | 100% | 161.8% | 261.8% |
| Up | 1363.55 | 1483.26 | 1557.25 | 1676.96 | 1870.66 |
| Dn | 1557.25 | 1437.54 | 1363.55 | 1243.84 | 1050.14 |
Intraday pivot levels:
| Sup 2 | Sup 1 | Pivot | Res 1 | Res 2 |
| 1460.80 | 1496.05 | 1515.50 | 1550.75 | 1570.20 |
Weekly pivot levels:
| Sup 2 | Sup 1 | Pivot | Res 1 | Res 2 |
| 1486.05 | 1502.40 | 1529.85 | 1546.20 | 1573.60 |
Monthly pivot levels:
| Sup 2 | Sup 1 | Pivot | Res 1 | Res 2 |
| 1368.20 | 1408.00 | 1439.80 | 1479.60 | 1511.35 |
Moving averages (simple):
| 5 Day | 20 Day | 50 Day | 200 Day |
| 1510 | 1489 | 1452 |
1555 |
Other levels:
| 52 Week Hi - Lo | Last Mnth Hi - Lo | Swing Hi - Lo | B Band Hi - Lo |
| 1757.50 - 1363.55 | 1471.60 - 1400.00 | 1557.25 - 1363.55 | 1572.20 - 1405.15 |
|
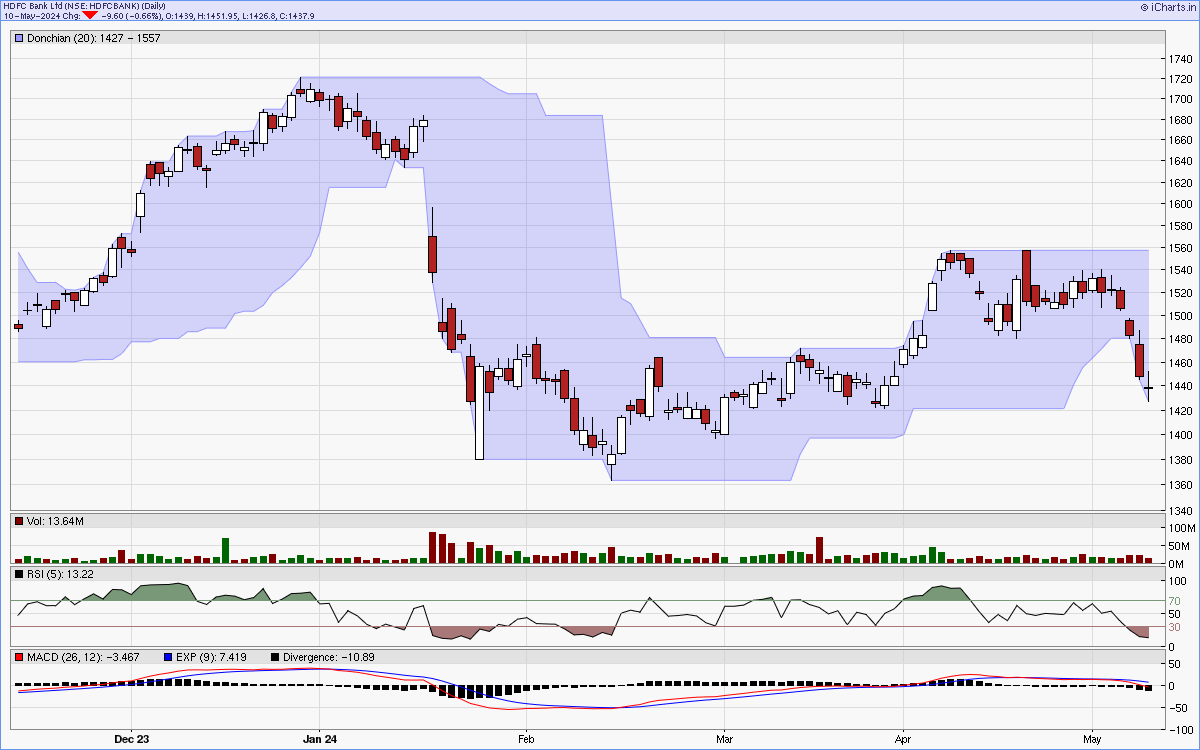
Charts...
Six months candlestick chart
Charts courtsey: iCharts.in
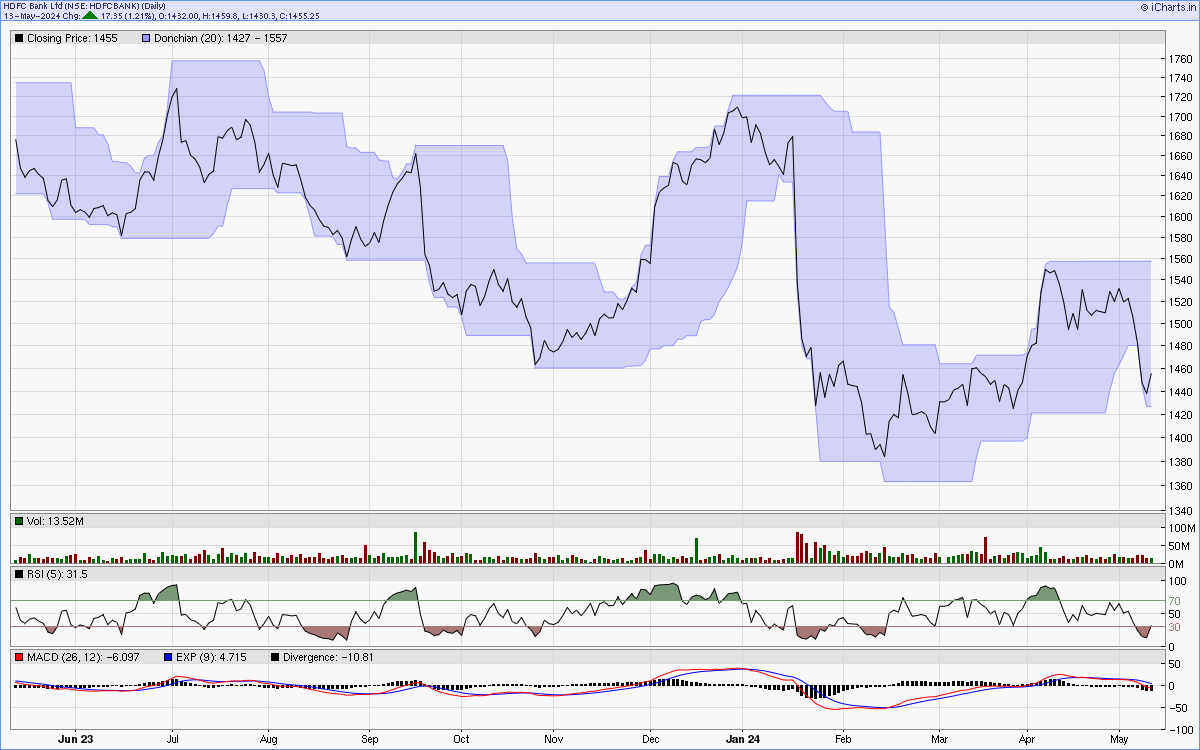
One year line chart
Two years weekly chart
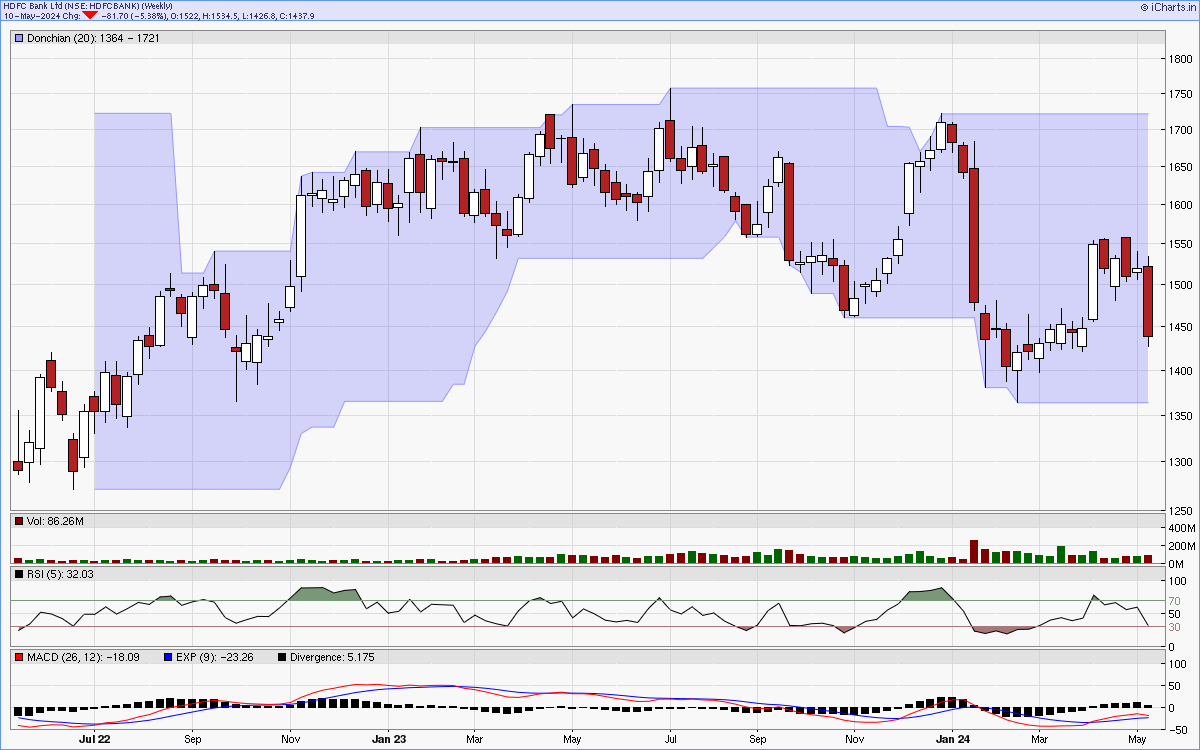
Charts courtsey: iCharts.in