Price / Percentage change:
| Open | High | Low | Close |
| Latest | 96.95 | 97.95 | 96.10 | 96.35 |
| Prev day | 95.60 | 98.65 | 95.40 | 96.30 |
| Last week | 95.95 | 96.90 | 89.55 | 91.80 |
| Last month | 107.95 | 112.30 | 80.25 | 91.80 |
| All time | | 117.80 | 8.10 | |
| 1 Day | 5 Day | 20 Day | 50 Day |
| 0.00% | 2.00% | 8.00% | -8.50% |
Trading range:
| TradingRange | Highest
Close | Lowest
Close | Highest
High | Lowest
Low |
| 5 days | 96.35 | 91.80 | 98.65 | 89.55 |
| 10 days | 99.00 | 91.80 | 101.30 | 89.55 |
| 20 days | 99.05 | 90.55 | 101.30 | 89.00 |
Trend analysis :
| Trend | First Signal | Price | Reversal | P SAR |
| SSS | 13-03-2024 | 83.70 | 101.30 | 100.61 |
| ATR (20d) | Williams R | RSI (5d) | RSI (14d) | Vol | Av Vol (20d) |
| 4.57 | 58 | 59 | 51 | 7267000 | 15310000
|
Fibonacci price projections:
| 0% | 61.8% | 100% | 161.8% | 261.8% |
| Up | 89.55 | 96.81 | 101.30 | 108.56 | 120.31 |
| Dn | 101.30 | 94.04 | 89.55 | 82.29 | 70.54 |
Intraday pivot levels:
| Sup 2 | Sup 1 | Pivot | Res 1 | Res 2 |
| 94.90 | 95.60 | 96.80 | 97.50 | 98.65 |
Weekly pivot levels:
| Sup 2 | Sup 1 | Pivot | Res 1 | Res 2 |
| 85.35 | 88.60 | 92.75 | 95.95 | 100.10 |
Monthly pivot levels:
| Sup 2 | Sup 1 | Pivot | Res 1 | Res 2 |
| 62.70 | 77.20 | 94.75 | 109.25 | 126.80 |
Moving averages (simple):
| 5 Day | 20 Day | 50 Day | 200 Day |
| 94 | 96 | 99 |
81 |
Other levels:
| 52 Week Hi - Lo | Last Mnth Hi - Lo | Swing Hi - Lo | B Band Hi - Lo |
| 117.80 - 61.50 | 112.30 - 80.25 | 101.30 - 89.55 | 101.00 - 90.03 |
|
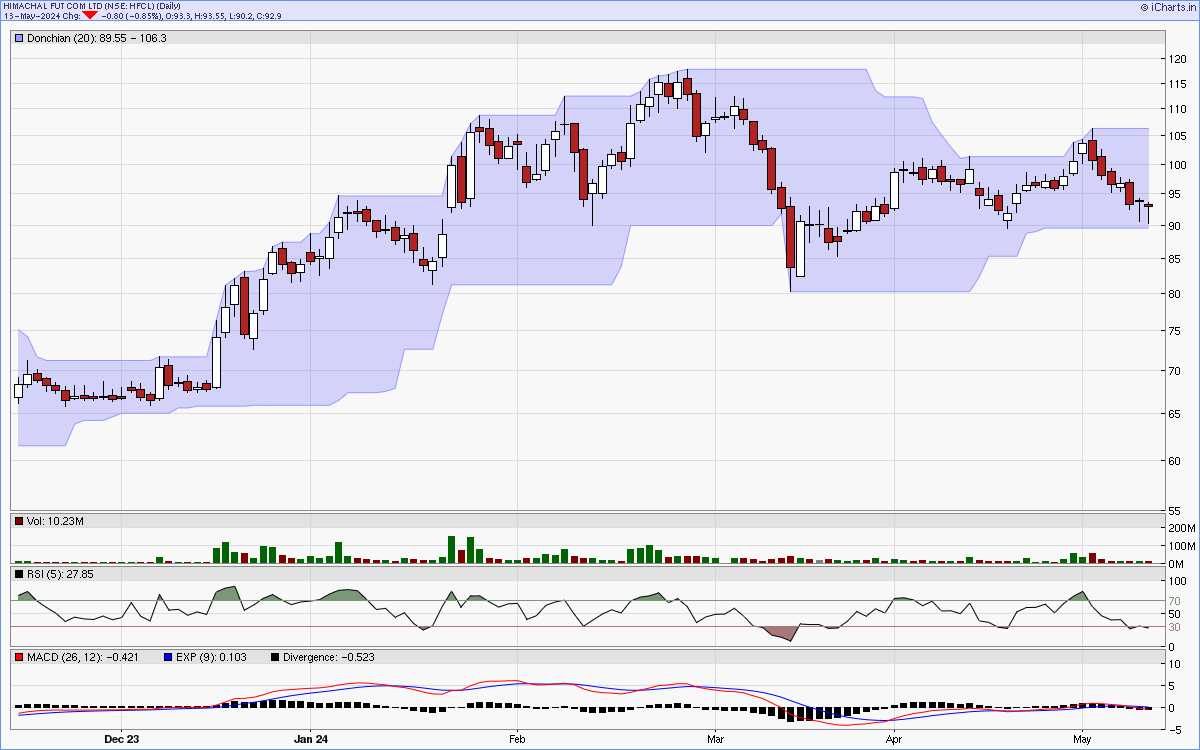
Charts...
Six months candlestick chart
Charts courtsey: iCharts.in
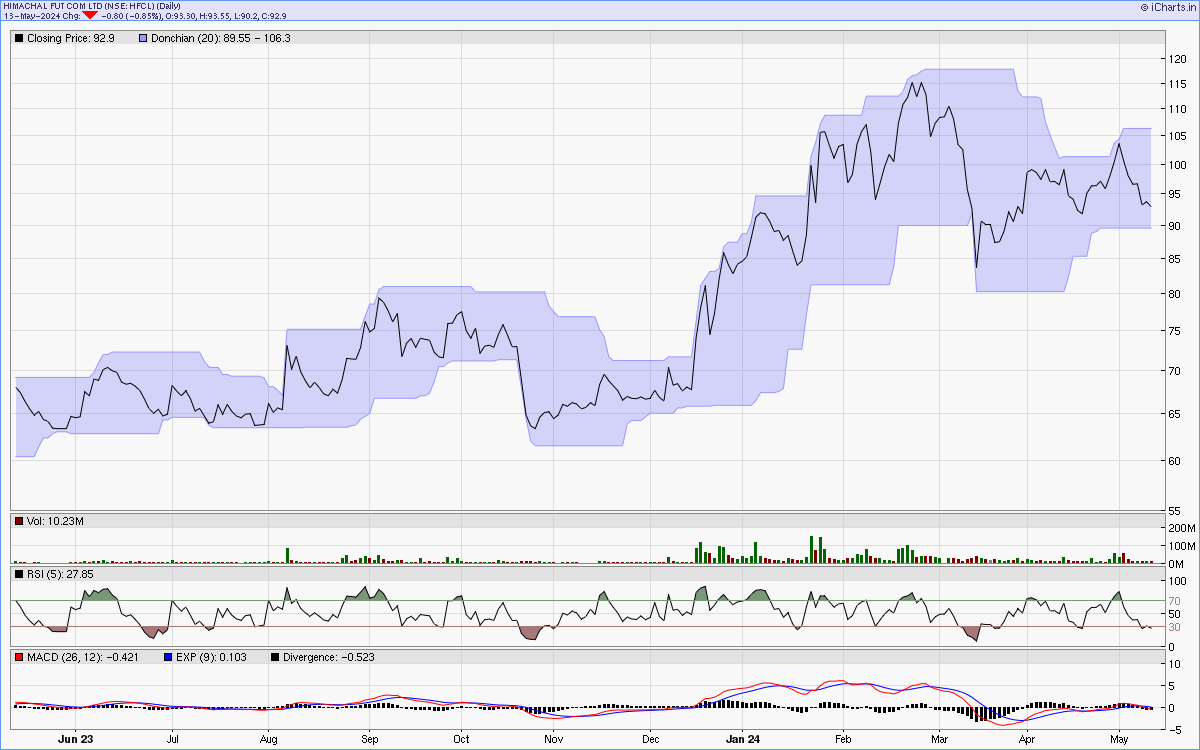
One year line chart
Two years weekly chart
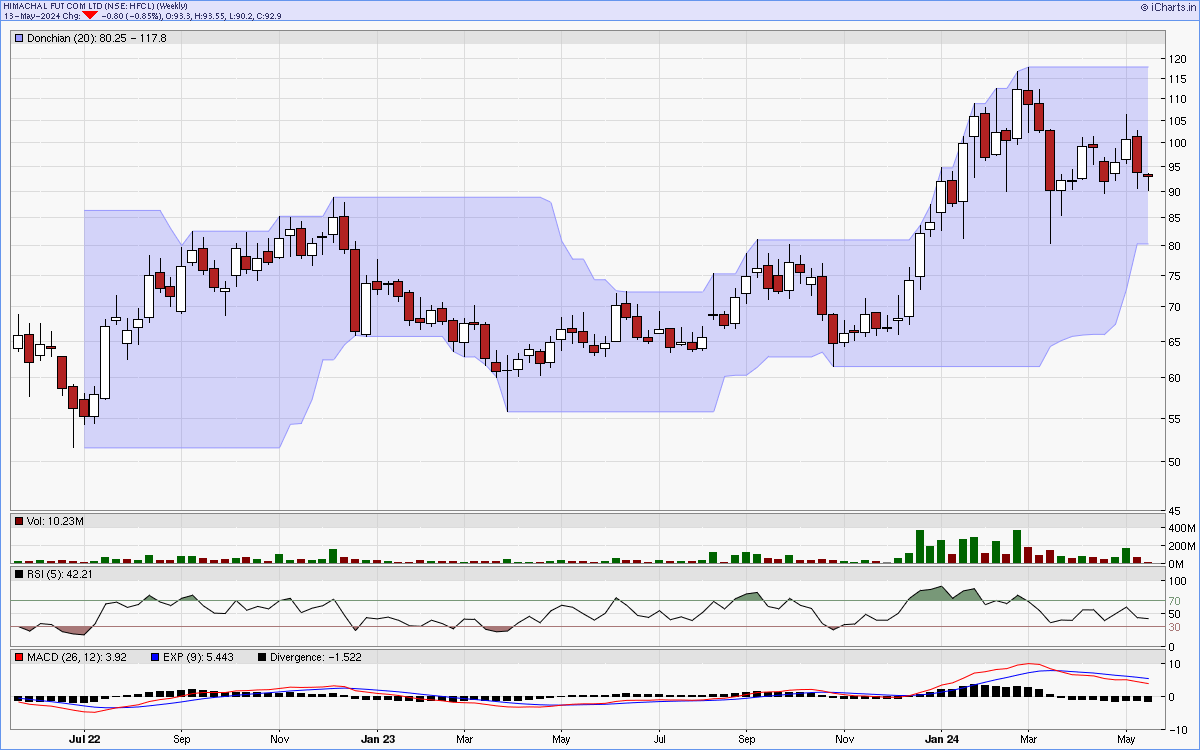
Charts courtsey: iCharts.in