Price / Percentage change:
| Open | High | Low | Close |
| Latest | 437.30 | 448.60 | 432.15 | 436.20 |
| Prev day | 467.00 | 470.35 | 435.35 | 437.30 |
| Last week | 461.90 | 482.70 | 458.10 | 463.10 |
| Last month | 427.70 | 460.00 | 397.15 | 430.80 |
| All time | | 602.05 | 11.13 | |
| 1 Day | 5 Day | 20 Day | 50 Day |
| 0.00% | -8.50% | 6.00% | -2.00% |
Trading range:
| TradingRange | Highest
Close | Lowest
Close | Highest
High | Lowest
Low |
| 5 days | 470.35 | 436.20 | 489.00 | 432.15 |
| 10 days | 477.05 | 436.20 | 489.00 | 432.15 |
| 20 days | 477.05 | 403.25 | 489.00 | 397.15 |
Trend analysis :
| Trend | First Signal | Price | Reversal | P SAR |
| BBB | 05-04-2024 | 460.10 | 397.15 | 487.93 |
| ATR (20d) | Williams R | RSI (5d) | RSI (14d) | Vol | Av Vol (20d) |
| 15.35 | 17 | 29 | 47 | 5765000 | 3595000
|
Fibonacci price projections:
| 0% | 61.8% | 100% | 161.8% | 261.8% |
| Up | 397.15 | 453.91 | 489.00 | 545.76 | 637.61 |
| Dn | 489.00 | 432.24 | 397.15 | 340.39 | 248.54 |
Intraday pivot levels:
| Sup 2 | Sup 1 | Pivot | Res 1 | Res 2 |
| 422.45 | 429.30 | 438.95 | 445.75 | 455.40 |
Weekly pivot levels:
| Sup 2 | Sup 1 | Pivot | Res 1 | Res 2 |
| 443.35 | 453.20 | 467.95 | 477.80 | 492.55 |
Monthly pivot levels:
| Sup 2 | Sup 1 | Pivot | Res 1 | Res 2 |
| 366.45 | 398.60 | 429.30 | 461.45 | 492.15 |
Moving averages (simple):
| 5 Day | 20 Day | 50 Day | 200 Day |
| 454 | 442 | 436 |
438 |
Other levels:
| 52 Week Hi - Lo | Last Mnth Hi - Lo | Swing Hi - Lo | B Band Hi - Lo |
| 515.70 - 375.70 | 460.00 - 397.15 | 489.00 - 397.15 | 488.45 - 394.56 |
|
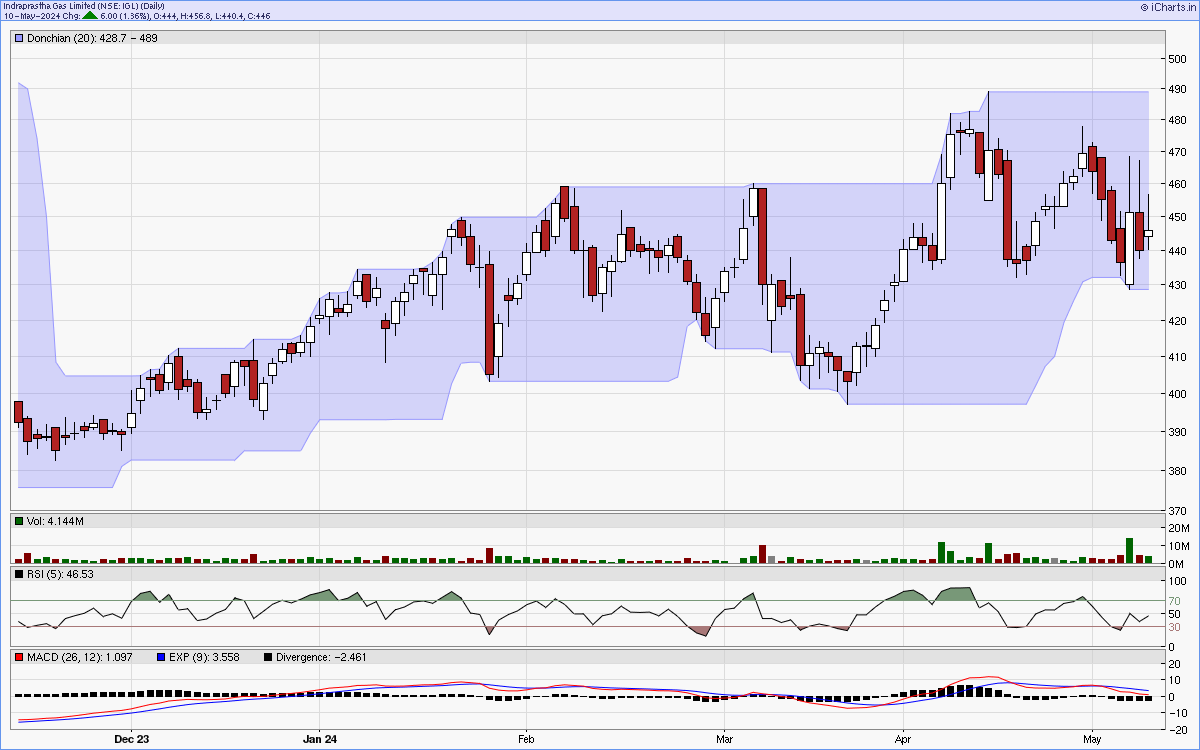
Charts...
Six months candlestick chart
Charts courtsey: iCharts.in
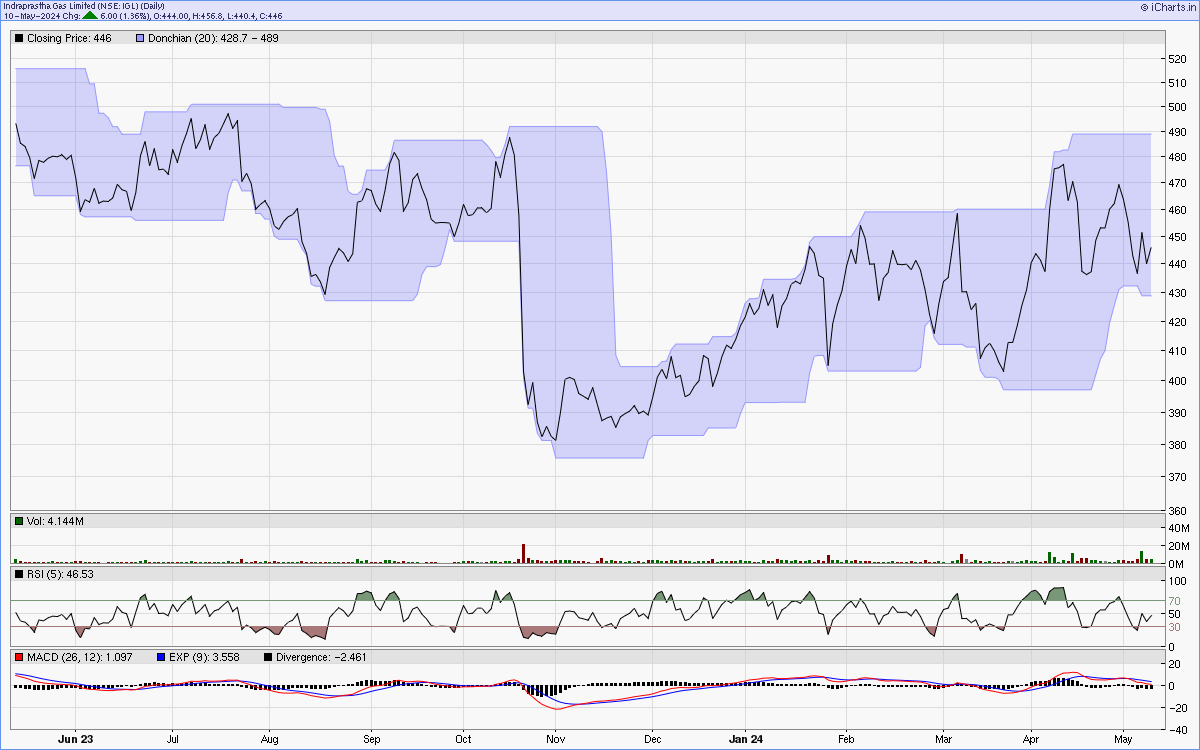
One year line chart
Two years weekly chart
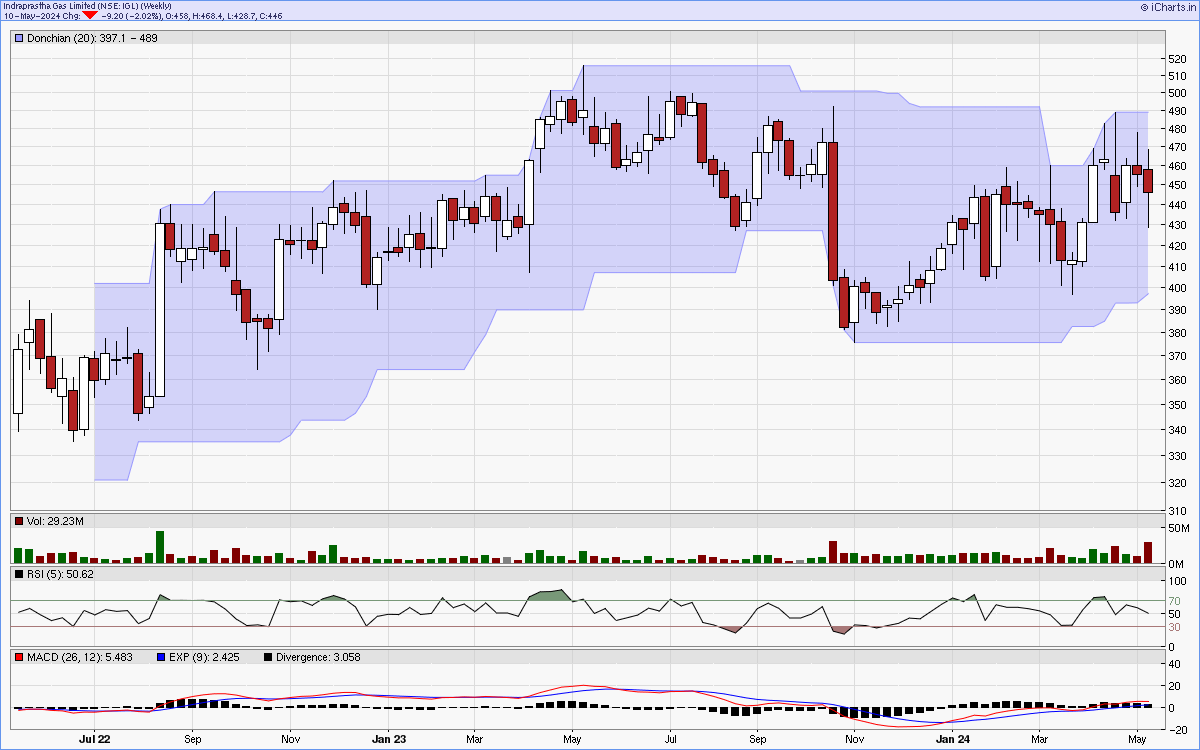
Charts courtsey: iCharts.in