Price / Percentage change:
| Open | High | Low | Close |
| Latest | 5024.00 | 5125.00 | 4970.00 | 5065.75 |
| Prev day | 4911.00 | 5077.95 | 4901.00 | 5010.45 |
| Last week | 4899.00 | 4985.00 | 4693.00 | 4938.30 |
| Last month | 4735.05 | 5360.00 | 4693.00 | 4838.55 |
| All time | | 7588.80 | 598.00 | |
| 1 Day | 5 Day | 20 Day | 50 Day |
| 1.00% | 2.50% | 4.50% | 16.00% |
Trading range:
| TradingRange | Highest
Close | Lowest
Close | Highest
High | Lowest
Low |
| 5 days | 5065.75 | 4838.55 | 5125.00 | 4820.00 |
| 10 days | 5065.75 | 4742.05 | 5125.00 | 4693.00 |
| 20 days | 5155.70 | 4742.05 | 5360.00 | 4693.00 |
Trend analysis :
| Trend | First Signal | Price | Reversal | P SAR |
| BBB | 01-11-2022 | 4845.65 | 4693.00 | 4700.70 |
| ATR (20d) | Williams R | RSI (5d) | RSI (14d) | Vol | Av Vol (20d) |
| 139.08 | 56 | 71 | 61 | 783000 | 493000
|
Fibonacci price projections:
| 0% | 61.8% | 100% | 161.8% | 261.8% |
| Up | 4693.00 | 5105.21 | 5360.00 | 5772.21 | 6439.21 |
| Dn | 5360.00 | 4947.79 | 4693.00 | 4280.79 | 3613.79 |
Intraday pivot levels:
| Sup 2 | Sup 1 | Pivot | Res 1 | Res 2 |
| 4898.55 | 4982.10 | 5053.55 | 5137.10 | 5208.55 |
Weekly pivot levels:
| Sup 2 | Sup 1 | Pivot | Res 1 | Res 2 |
| 4580.05 | 4759.10 | 4872.05 | 5051.10 | 5164.05 |
Monthly pivot levels:
| Sup 2 | Sup 1 | Pivot | Res 1 | Res 2 |
| 4296.80 | 4567.60 | 4963.80 | 5234.60 | 5630.80 |
Moving averages (simple):
| 5 Day | 20 Day | 50 Day | 200 Day |
| 4954 | 4925 | 4740 |
4880 |
Other levels:
| 52 Week Hi - Lo | Last Mnth Hi - Lo | Swing Hi - Lo | B Band Hi - Lo |
| 7588.80 - 3733.30 | 5360.00 - 4693.00 | 5360.00 - 4693.00 | 5163.50 - 4687.21 |
|
Charts...
Six months candlestick chart
Charts courtsey: iCharts.in

One year line chart

Two years weekly chart
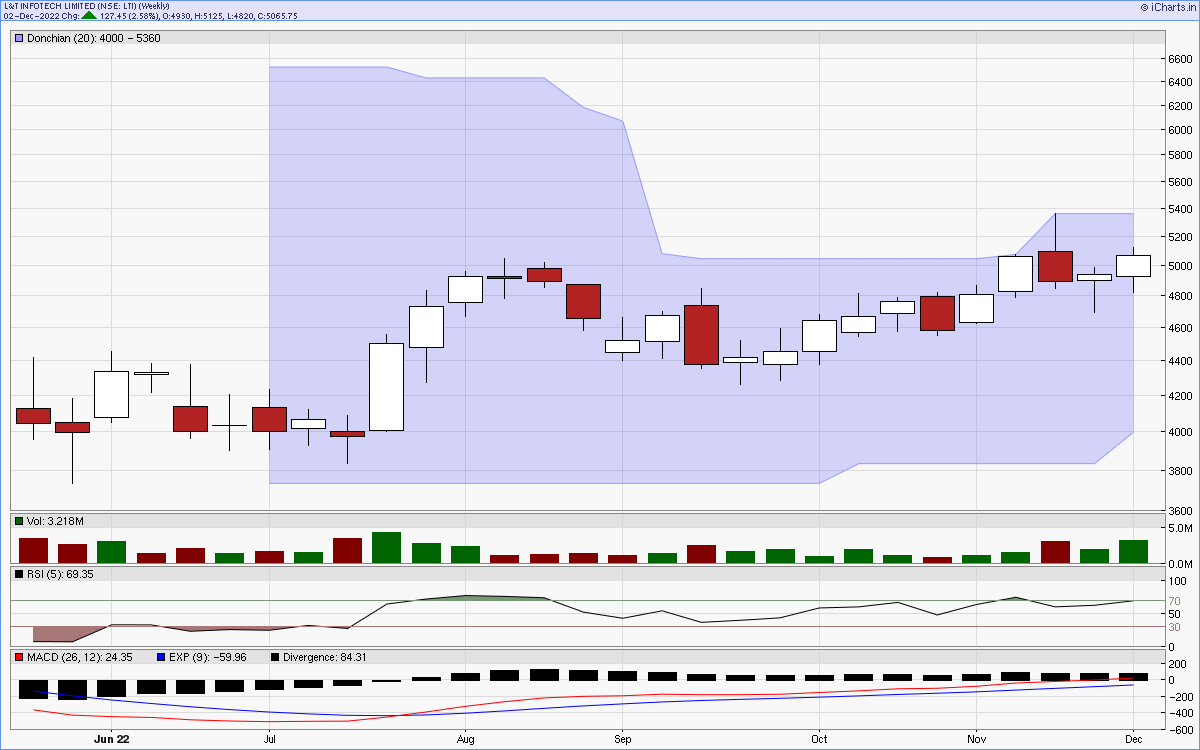
Charts courtsey: iCharts.in