Price / Percentage change:
| Open | High | Low | Close |
| Latest | 1720.00 | 1798.70 | 1702.00 | 1779.55 |
| Prev day | 1784.95 | 1815.00 | 1726.00 | 1741.95 |
| Last week | 1706.95 | 1800.00 | 1657.05 | 1768.65 |
| Last month | 1592.00 | 1742.00 | 1473.35 | 1727.75 |
| All time | | 1885.10 | 18.32 | |
| 1 Day | 5 Day | 20 Day | 50 Day |
| 2.00% | 3.50% | 13.00% | 5.50% |
Trading range:
| TradingRange | Highest
Close | Lowest
Close | Highest
High | Lowest
Low |
| 5 days | 1779.55 | 1724.45 | 1815.00 | 1665.20 |
| 10 days | 1779.55 | 1667.10 | 1815.00 | 1651.00 |
| 20 days | 1779.55 | 1610.65 | 1815.00 | 1568.20 |
Trend analysis :
| Trend | First Signal | Price | Reversal | P SAR |
| BBB | 28-03-2024 | 1727.75 | 1568.20 | 1671.19 |
| ATR (20d) | Williams R | RSI (5d) | RSI (14d) | Vol | Av Vol (20d) |
| 62.42 | 78 | 69 | 63 | 190000 | 252000
|
Fibonacci price projections:
| 0% | 61.8% | 100% | 161.8% | 261.8% |
| Up | 1651.00 | 1713.39 | 1751.95 | 1814.34 | 1915.29 |
| Dn | 1751.95 | 1689.56 | 1651.00 | 1588.61 | 1487.66 |
Intraday pivot levels:
| Sup 2 | Sup 1 | Pivot | Res 1 | Res 2 |
| 1663.35 | 1721.40 | 1760.05 | 1818.10 | 1856.75 |
Weekly pivot levels:
| Sup 2 | Sup 1 | Pivot | Res 1 | Res 2 |
| 1598.95 | 1683.80 | 1741.90 | 1826.75 | 1884.85 |
Monthly pivot levels:
| Sup 2 | Sup 1 | Pivot | Res 1 | Res 2 |
| 1379.05 | 1553.40 | 1647.70 | 1822.05 | 1916.35 |
Moving averages (simple):
| 5 Day | 20 Day | 50 Day | 200 Day |
| 1754 | 1696 | 1661 |
1467 |
Other levels:
| 52 Week Hi - Lo | Last Mnth Hi - Lo | Swing Hi - Lo | B Band Hi - Lo |
| 1885.10 - 1083.00 | 1742.00 - 1473.35 | 1751.95 - 1651.00 | 1788.04 - 1604.20 |
|
Charts...
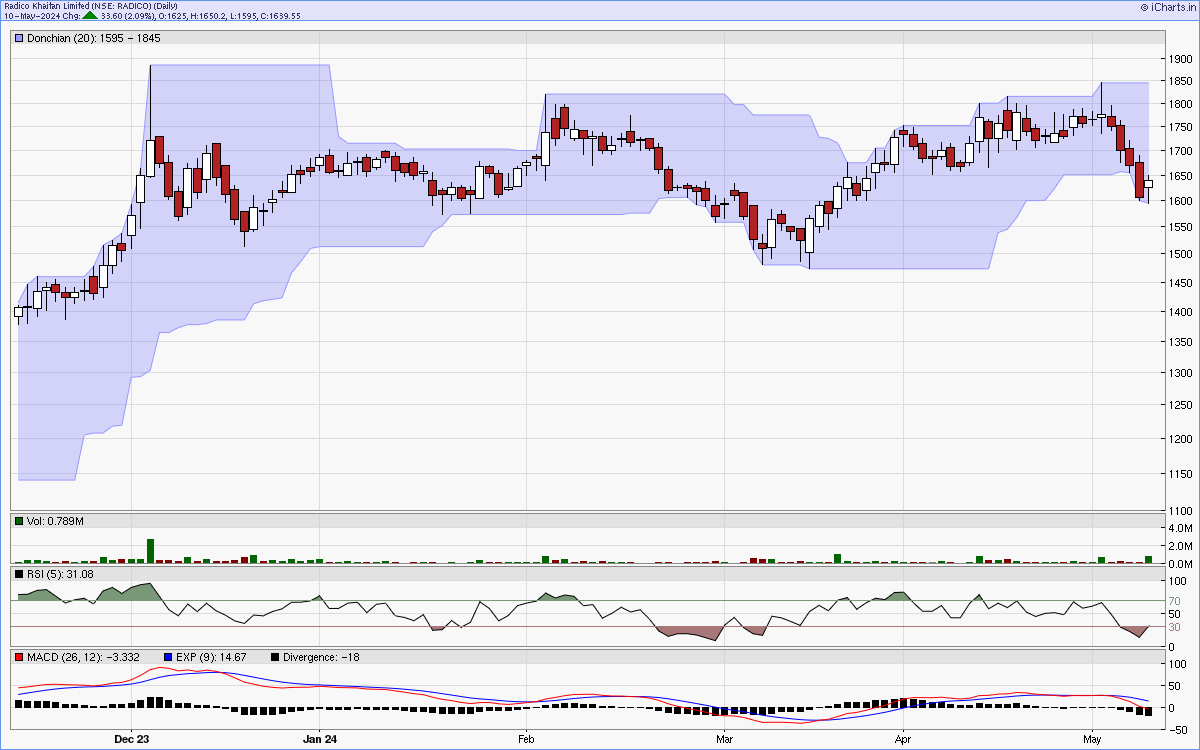
Six months candlestick chart
Charts courtsey: iCharts.in
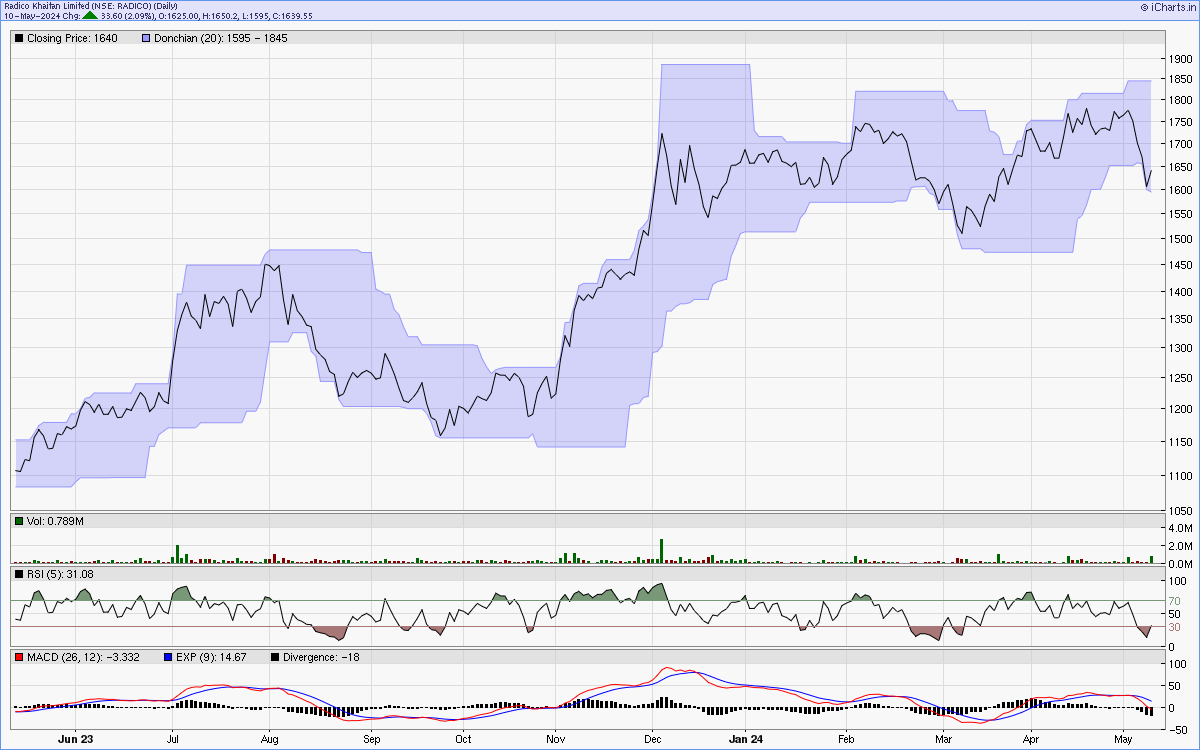
One year line chart
Two years weekly chart
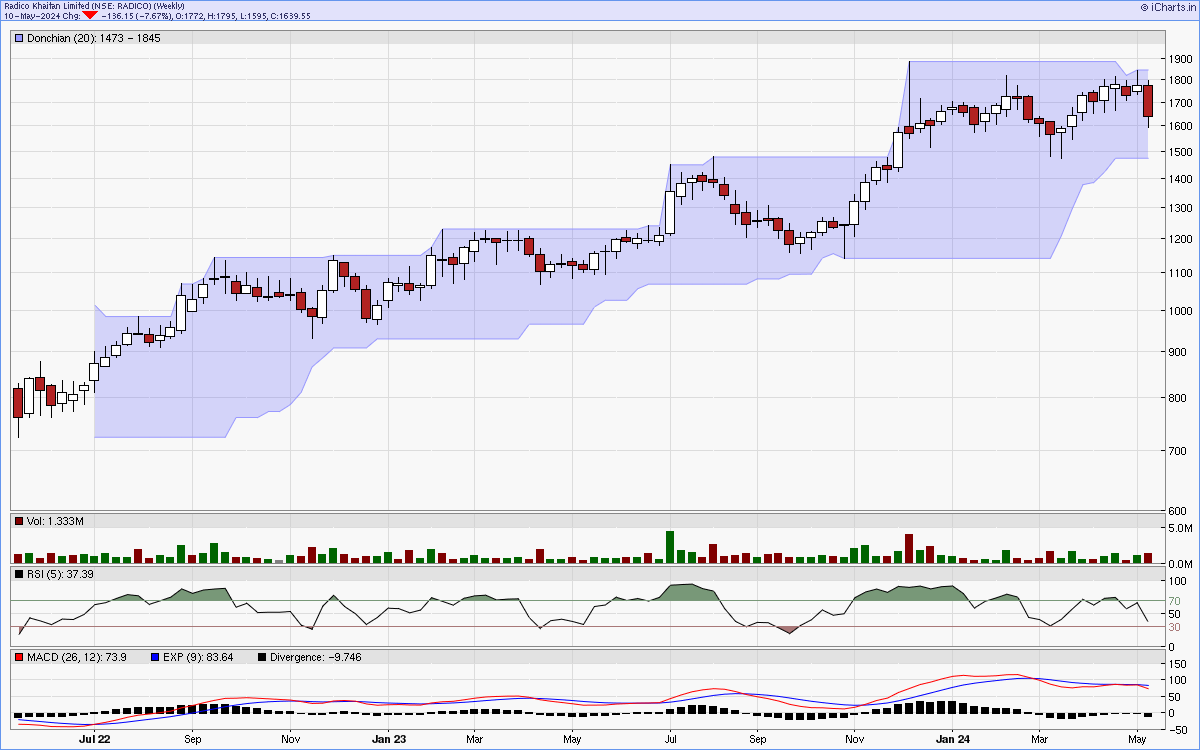
Charts courtsey: iCharts.in