Price / Percentage change:
| Open | High | Low | Close |
| Latest | 428.00 | 434.40 | 419.55 | 425.10 |
| Prev day | 418.90 | 421.50 | 410.00 | 416.15 |
| Last week | 380.90 | 427.05 | 370.30 | 421.85 |
| Last month | 333.45 | 365.00 | 321.00 | 352.70 |
| All time | | 434.40 | 13.93 | |
| 1 Day | 5 Day | 20 Day | 50 Day |
| 2.00% | 0.50% | 29.00% | 53.00% |
Trading range:
| TradingRange | Highest
Close | Lowest
Close | Highest
High | Lowest
Low |
| 5 days | 425.10 | 414.95 | 434.40 | 407.05 |
| 10 days | 425.10 | 375.65 | 434.40 | 370.30 |
| 20 days | 425.10 | 324.15 | 434.40 | 321.00 |
Trend analysis :
| Trend | First Signal | Price | Reversal | P SAR |
| BBB | 08-03-2023 | 245.30 | 321.00 | 396.36 |
| ATR (20d) | Williams R | RSI (5d) | RSI (14d) | Vol | Av Vol (20d) |
| 16.48 | 89 | 86 | 78 | 1591000 | 973000
|
Fibonacci price projections:
| 0% | 61.8% | 100% | 161.8% | 261.8% |
| Up | 321.00 | 343.87 | 358.00 | 380.87 | 417.87 |
| Dn | 358.00 | 335.13 | 321.00 | 298.13 | 261.13 |
Intraday pivot levels:
| Sup 2 | Sup 1 | Pivot | Res 1 | Res 2 |
| 411.50 | 418.30 | 426.35 | 433.15 | 441.20 |
Weekly pivot levels:
| Sup 2 | Sup 1 | Pivot | Res 1 | Res 2 |
| 349.65 | 385.70 | 406.40 | 442.45 | 463.15 |
Monthly pivot levels:
| Sup 2 | Sup 1 | Pivot | Res 1 | Res 2 |
| 302.20 | 327.40 | 346.20 | 371.40 | 390.20 |
Moving averages (simple):
| 5 Day | 20 Day | 50 Day | 200 Day |
| 418 | 377 | 344 |
232 |
Other levels:
| 52 Week Hi - Lo | Last Mnth Hi - Lo | Swing Hi - Lo | B Band Hi - Lo |
| 434.40 - 93.40 | 365.00 - 321.00 | 358.00 - 321.00 | 441.95 - 312.61 |
|
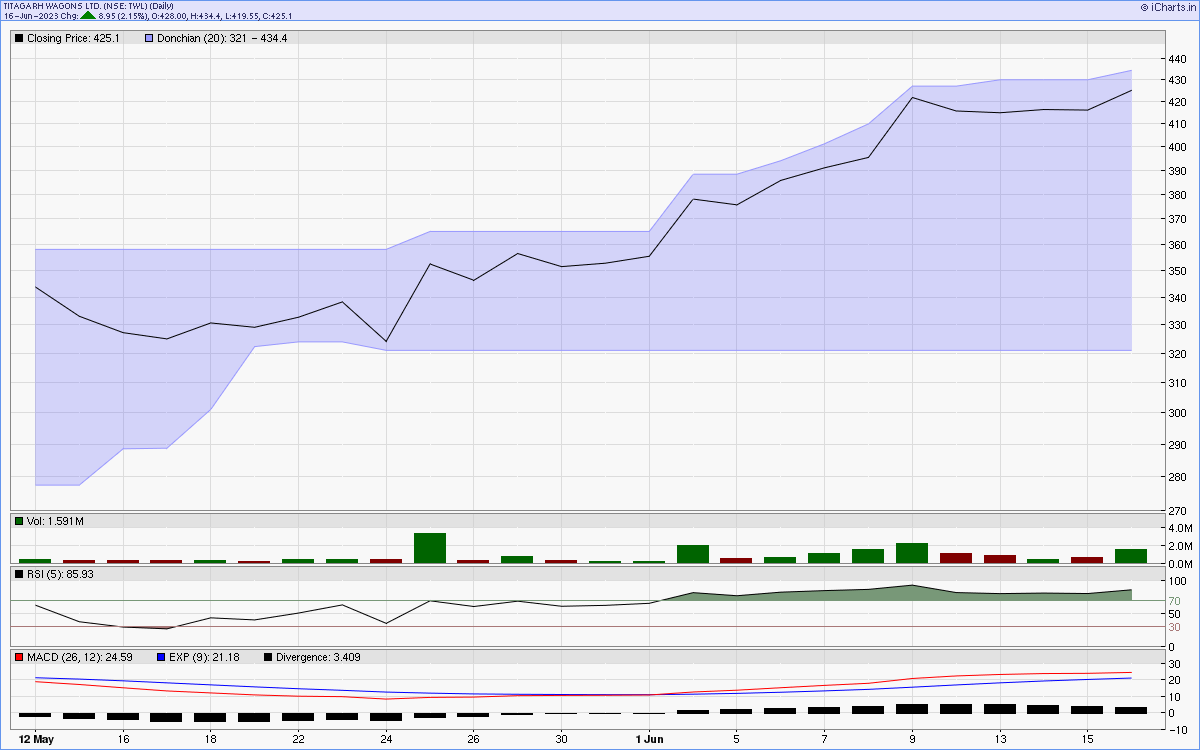
Charts...
Six months candlestick chart
Charts courtsey: iCharts.in

One year line chart
Two years weekly chart
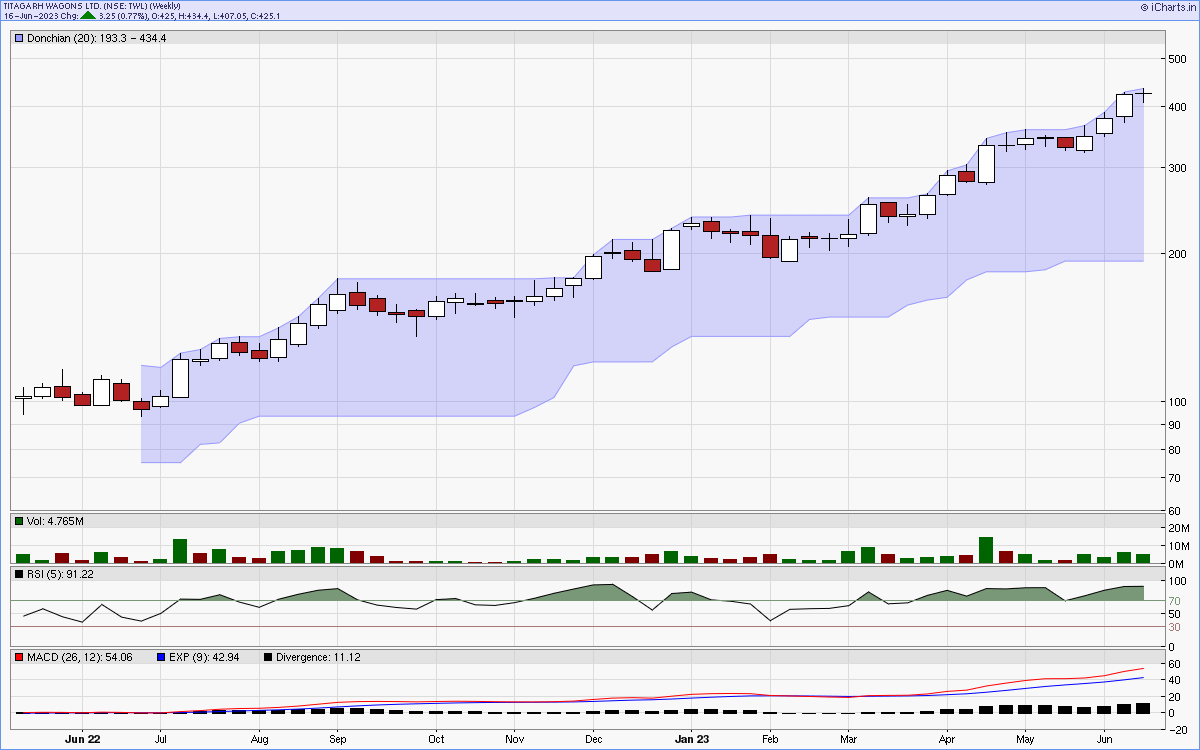
Charts courtsey: iCharts.in