Price / Percentage change:
| Open | High | Low | Close |
| Latest | 2130.45 | 2179.00 | 2122.30 | 2164.75 |
| Prev day | 2087.45 | 2145.00 | 2083.85 | 2130.45 |
| Last week | 2060.00 | 2119.95 | 2030.00 | 2051.95 |
| Last month | 1918.95 | 2176.60 | 1815.10 | 2153.95 |
| All time | | 4848.80 | 103.25 | |
| 1 Day | 5 Day | 20 Day | 50 Day |
| 1.50% | 5.50% | 4.00% | 0.00% |
Trading range:
| TradingRange | Highest
Close | Lowest
Close | Highest
High | Lowest
Low |
| 5 days | 2164.75 | 2054.15 | 2179.00 | 2044.05 |
| 10 days | 2164.75 | 2051.95 | 2179.00 | 2030.00 |
| 20 days | 2197.50 | 2051.95 | 2252.60 | 2030.00 |
Trend analysis :
| Trend | First Signal | Price | Reversal | P SAR |
| BBB | 26-03-2024 | 2078.35 | 2030.00 | 2030.00 |
| ATR (20d) | Williams R | RSI (5d) | RSI (14d) | Vol | Av Vol (20d) |
| 66.69 | 61 | 79 | 63 | 19000 | 24000
|
Fibonacci price projections:
| 0% | 61.8% | 100% | 161.8% | 261.8% |
| Up | 2030.00 | 2167.57 | 2252.60 | 2390.17 | 2612.77 |
| Dn | 2252.60 | 2115.03 | 2030.00 | 1892.43 | 1669.83 |
Intraday pivot levels:
| Sup 2 | Sup 1 | Pivot | Res 1 | Res 2 |
| 2098.65 | 2131.70 | 2155.35 | 2188.35 | 2212.00 |
Weekly pivot levels:
| Sup 2 | Sup 1 | Pivot | Res 1 | Res 2 |
| 1977.30 | 2014.55 | 2067.25 | 2104.50 | 2157.20 |
Monthly pivot levels:
| Sup 2 | Sup 1 | Pivot | Res 1 | Res 2 |
| 1687.00 | 1920.40 | 2048.50 | 2281.90 | 2410.00 |
Moving averages (simple):
| 5 Day | 20 Day | 50 Day | 200 Day |
| 2101 | 2121 | 2030 |
2032 |
Other levels:
| 52 Week Hi - Lo | Last Mnth Hi - Lo | Swing Hi - Lo | B Band Hi - Lo |
| 2444.95 - 1595.00 | 2176.60 - 1815.10 | 2252.60 - 2030.00 | 2207.20 - 2034.43 |
|
Charts...
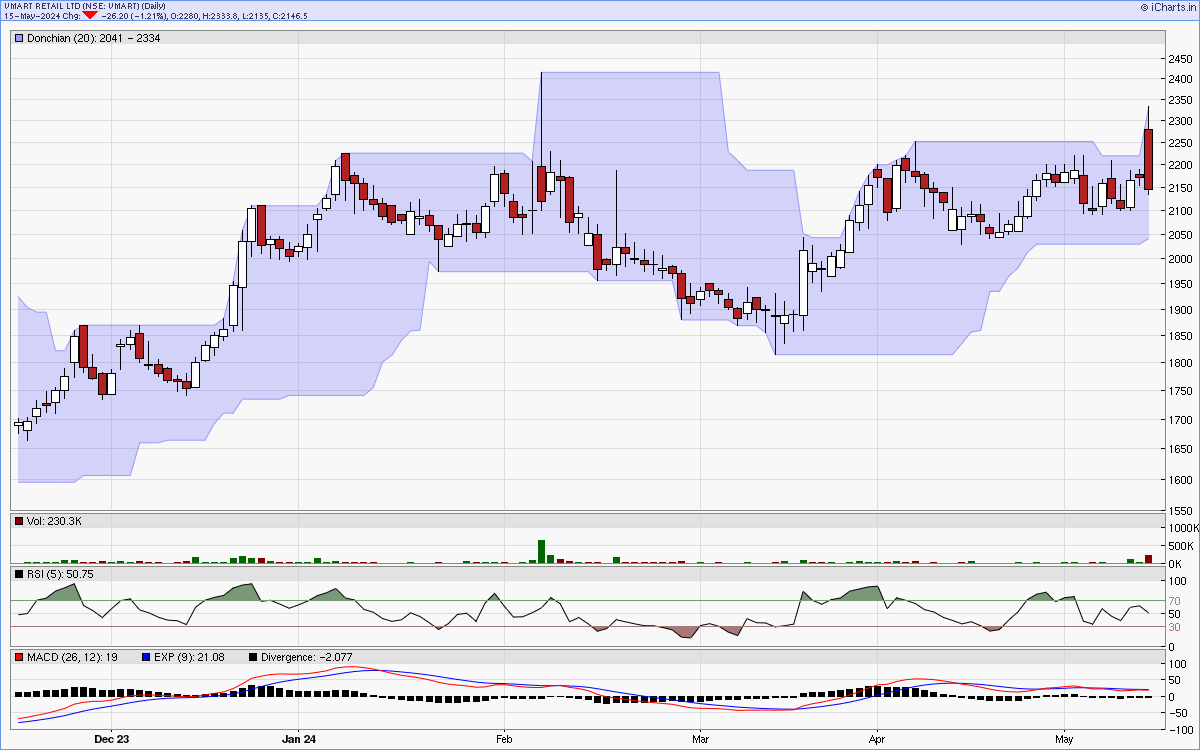
Six months candlestick chart
Charts courtsey: iCharts.in
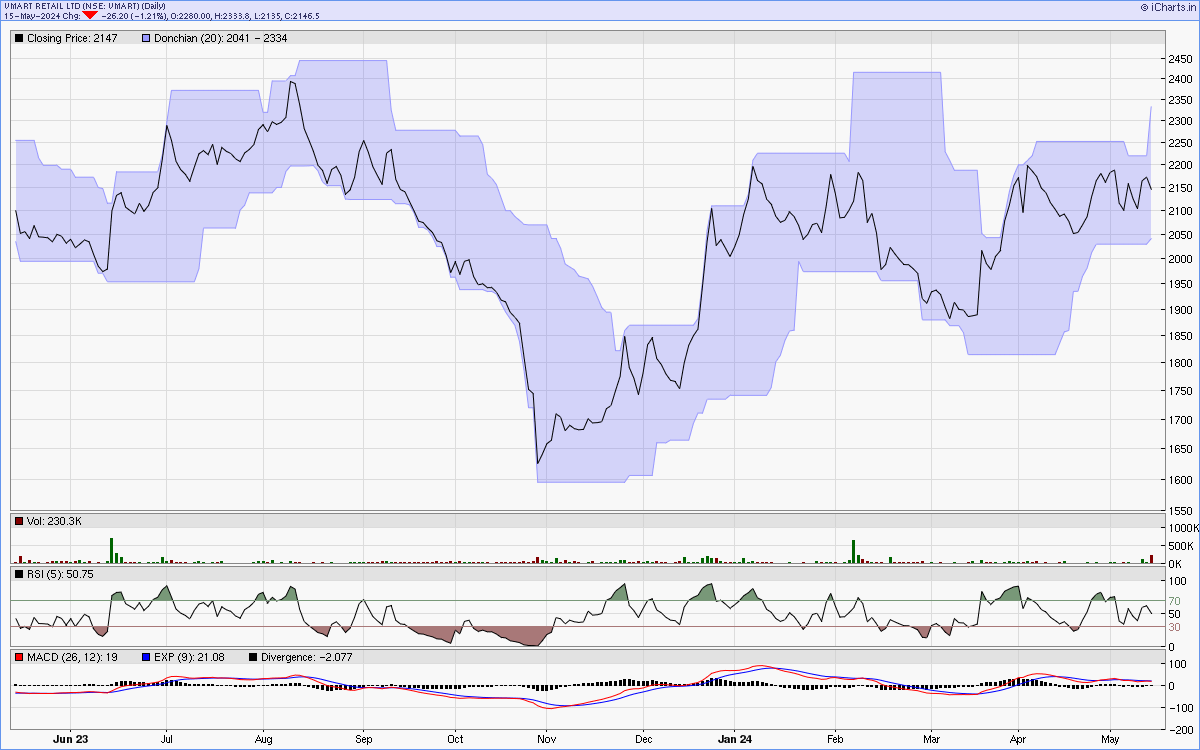
One year line chart
Two years weekly chart
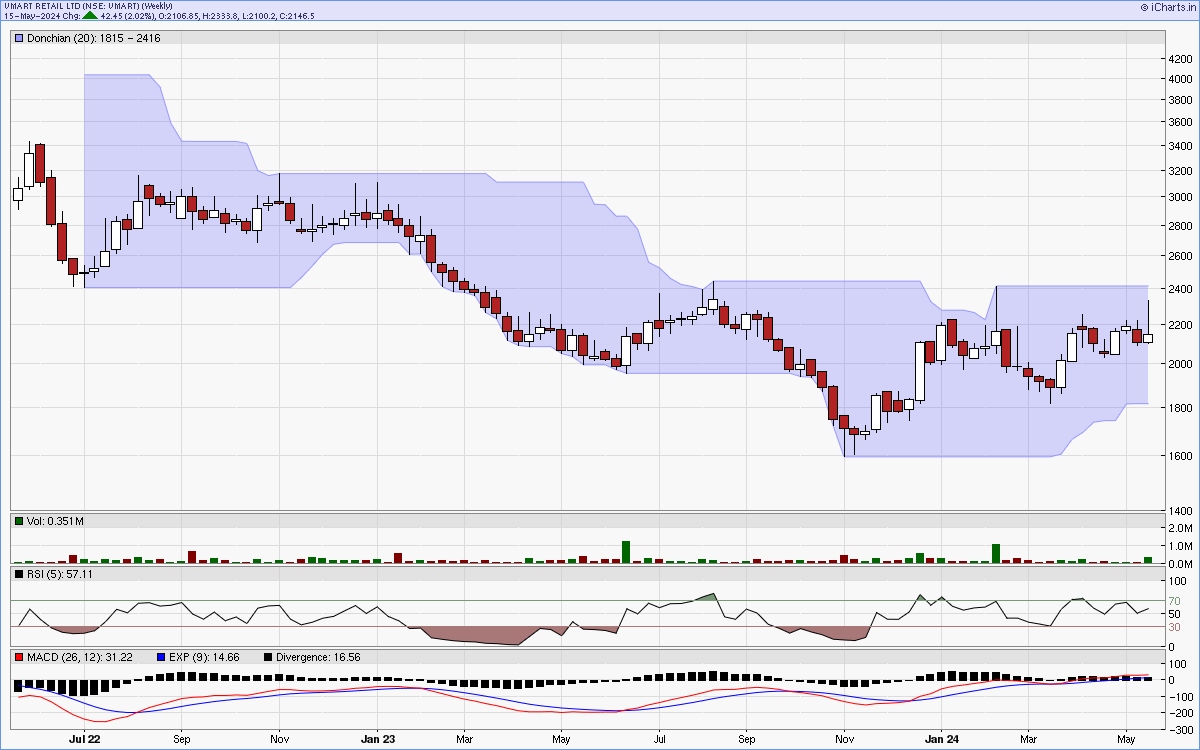
Charts courtsey: iCharts.in