Price / Percentage change:
| Open | High | Low | Close |
| Latest | 39.05 | 39.55 | 38.55 | 38.80 |
| Prev day | 39.85 | 40.65 | 38.80 | 38.95 |
| Last week | 39.10 | 41.95 | 37.90 | 40.00 |
| Last month | 39.95 | 46.00 | 37.90 | 38.95 |
| All time | | 119.30 | 26.25 | |
| 1 Day | 5 Day | 20 Day | 50 Day |
| 0.00% | -3.00% | -9.50% | -21.00% |
Trading range:
| TradingRange | Highest
Close | Lowest
Close | Highest
High | Lowest
Low |
| 5 days | 40.10 | 38.80 | 40.75 | 38.55 |
| 10 days | 40.10 | 38.40 | 41.95 | 37.90 |
| 20 days | 45.35 | 38.40 | 46.00 | 37.90 |
Technical levels / commentary unreliable for this stock due to low volumes/ poor liquidity
Trend analysis :
| Trend | First Signal | Price | Reversal | P SAR |
| SSS | 09-02-2024 | 50.25 | 46.00 | 40.75 |
| ATR (20d) | Williams R | RSI (5d) | RSI (14d) | Vol | Av Vol (20d) |
| 1.93 | 19 | 29 | 38 | 892000 | 1202000
|
Fibonacci price projections:
| 0% | 61.8% | 100% | 161.8% | 261.8% |
| Up | 37.90 | 40.40 | 41.95 | 44.45 | 48.50 |
| Dn | 41.95 | 39.45 | 37.90 | 35.40 | 31.35 |
Intraday pivot levels:
| Sup 2 | Sup 1 | Pivot | Res 1 | Res 2 |
| 37.95 | 38.35 | 38.95 | 39.35 | 39.95 |
Weekly pivot levels:
| Sup 2 | Sup 1 | Pivot | Res 1 | Res 2 |
| 35.80 | 37.80 | 39.90 | 41.90 | 43.95 |
Monthly pivot levels:
| Sup 2 | Sup 1 | Pivot | Res 1 | Res 2 |
| 32.85 | 35.90 | 40.95 | 44.00 | 49.05 |
Moving averages (simple):
| 5 Day | 20 Day | 50 Day | 200 Day |
| 40 | 41 | 44 |
42 |
Other levels:
| 52 Week Hi - Lo | Last Mnth Hi - Lo | Swing Hi - Lo | B Band Hi - Lo |
| 63.90 - 30.70 | 46.00 - 37.90 | 41.95 - 37.90 | 45.38 - 36.66 |
|
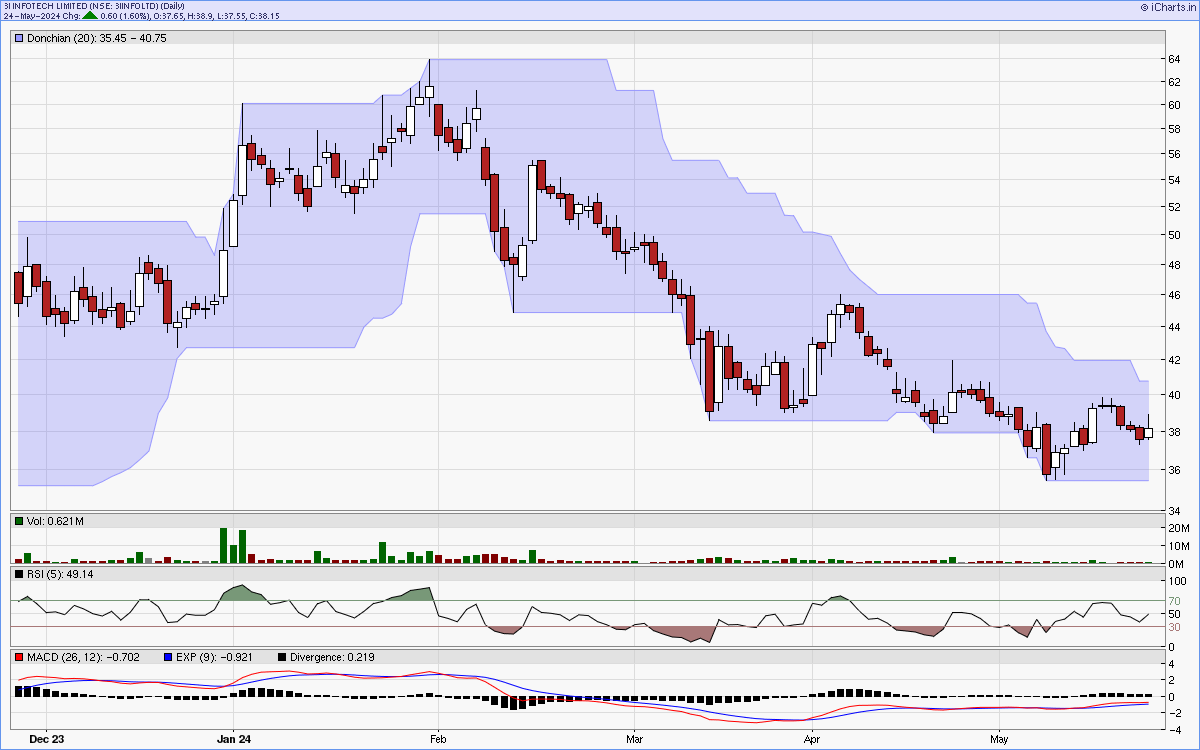
Charts...
Six months candlestick chart
Charts courtsey: iCharts.in
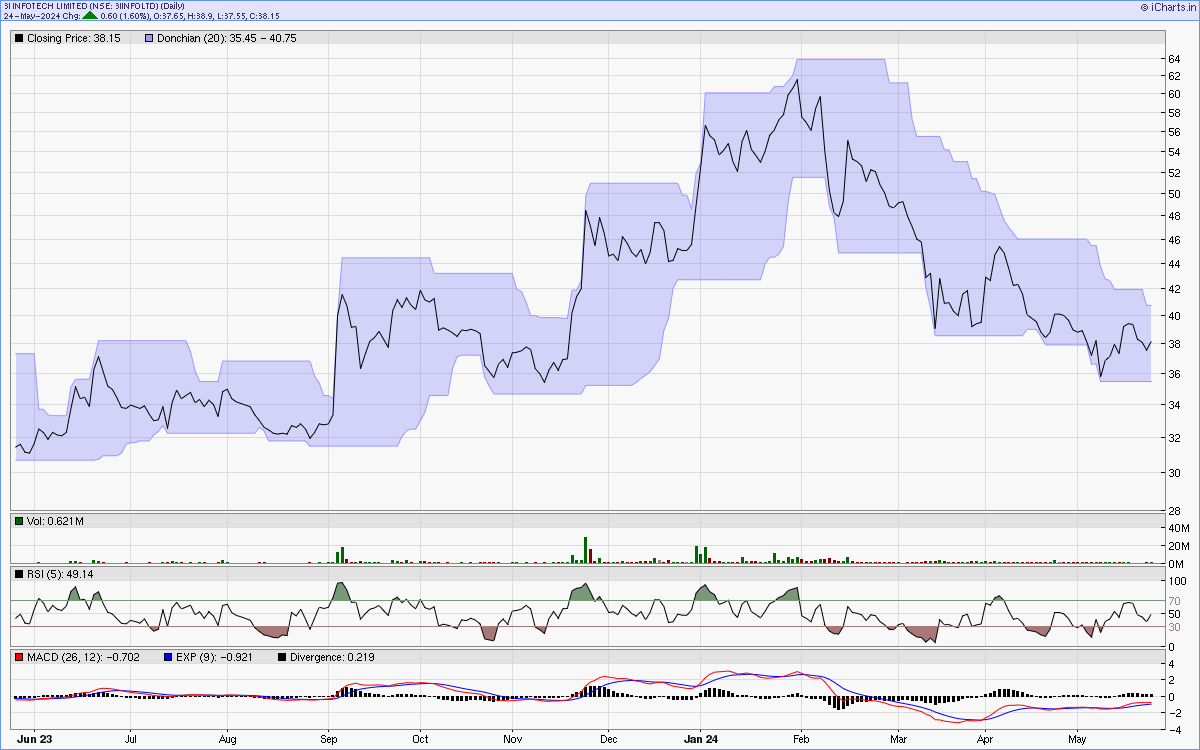
One year line chart
Two years weekly chart
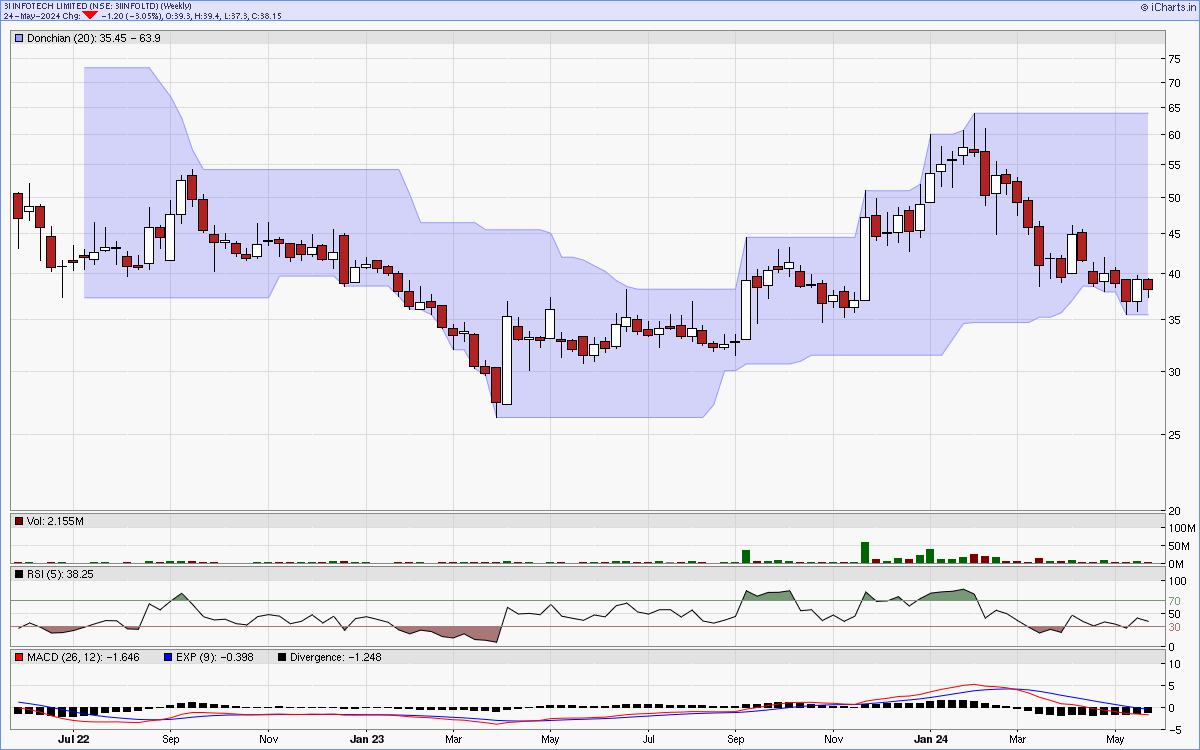
Charts courtsey: iCharts.in