Price / Percentage change:
| Open | High | Low | Close |
| Latest | 395.50 | 397.20 | 388.55 | 394.95 |
| Prev day | 395.10 | 396.50 | 386.40 | 395.50 |
| Last week | 372.00 | 395.00 | 368.00 | 391.75 |
| Last month | 343.80 | 397.45 | 343.80 | 395.10 |
| All time | | 503.70 | 98.10 | |
| 1 Day | 5 Day | 20 Day | 50 Day |
| 0.00% | 2.00% | 8.00% | -4.00% |
Trading range:
| TradingRange | Highest
Close | Lowest
Close | Highest
High | Lowest
Low |
| 5 days | 395.50 | 390.90 | 397.45 | 385.20 |
| 10 days | 395.50 | 366.25 | 397.45 | 349.95 |
| 20 days | 395.50 | 358.90 | 397.45 | 349.25 |
Trend analysis :
| Trend | First Signal | Price | Reversal | P SAR |
| BBB | 22-04-2024 | 379.80 | 349.25 | 376.00 |
| ATR (20d) | Williams R | RSI (5d) | RSI (14d) | Vol | Av Vol (20d) |
| 12.62 | 95 | 85 | 69 | 184000 | 166000
|
Fibonacci price projections:
| 0% | 61.8% | 100% | 161.8% | 261.8% |
| Up | 349.25 | 378.23 | 396.15 | 425.13 | 472.03 |
| Dn | 396.15 | 367.17 | 349.25 | 320.27 | 273.37 |
Intraday pivot levels:
| Sup 2 | Sup 1 | Pivot | Res 1 | Res 2 |
| 384.90 | 389.90 | 393.55 | 398.55 | 402.20 |
Weekly pivot levels:
| Sup 2 | Sup 1 | Pivot | Res 1 | Res 2 |
| 357.90 | 374.75 | 384.90 | 401.75 | 411.90 |
Monthly pivot levels:
| Sup 2 | Sup 1 | Pivot | Res 1 | Res 2 |
| 325.10 | 360.05 | 378.75 | 413.70 | 432.40 |
Moving averages (simple):
| 5 Day | 20 Day | 50 Day | 200 Day |
| 394 | 374 | 374 |
348 |
Other levels:
| 52 Week Hi - Lo | Last Mnth Hi - Lo | Swing Hi - Lo | B Band Hi - Lo |
| 425.15 - 265.60 | 397.45 - 343.80 | 396.15 - 349.25 | 402.83 - 346.06 |
|
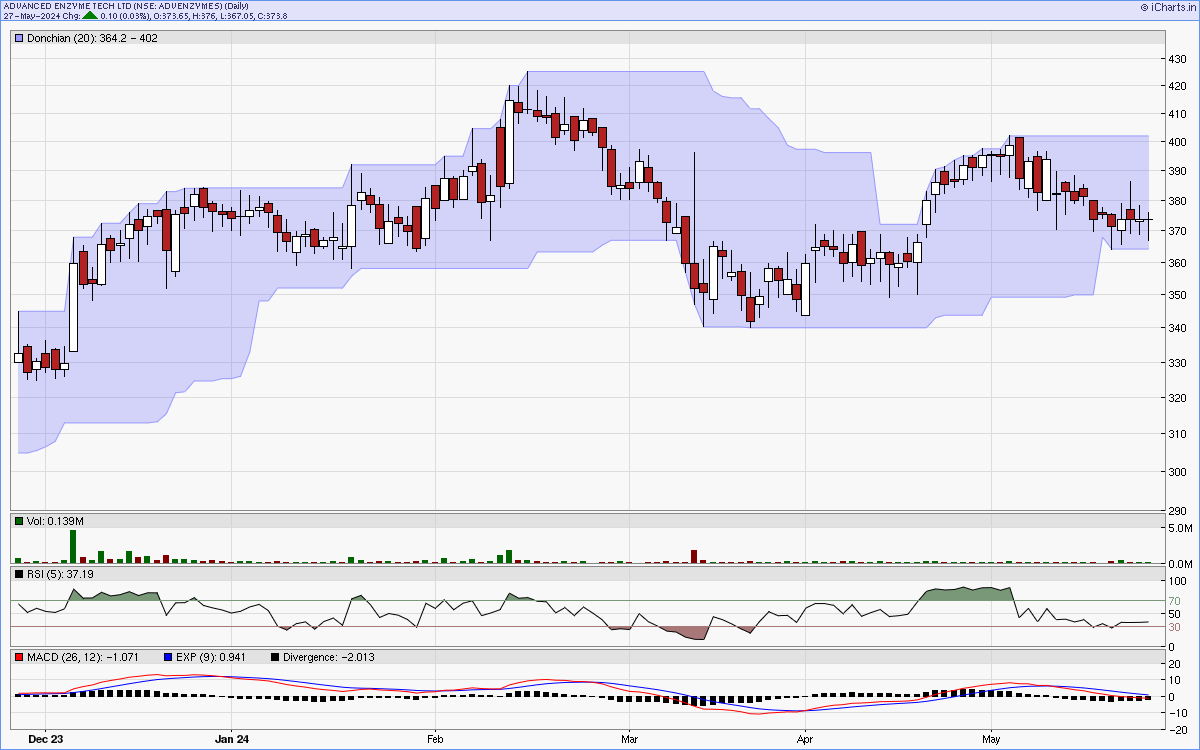
Charts...
Six months candlestick chart
Charts courtsey: iCharts.in
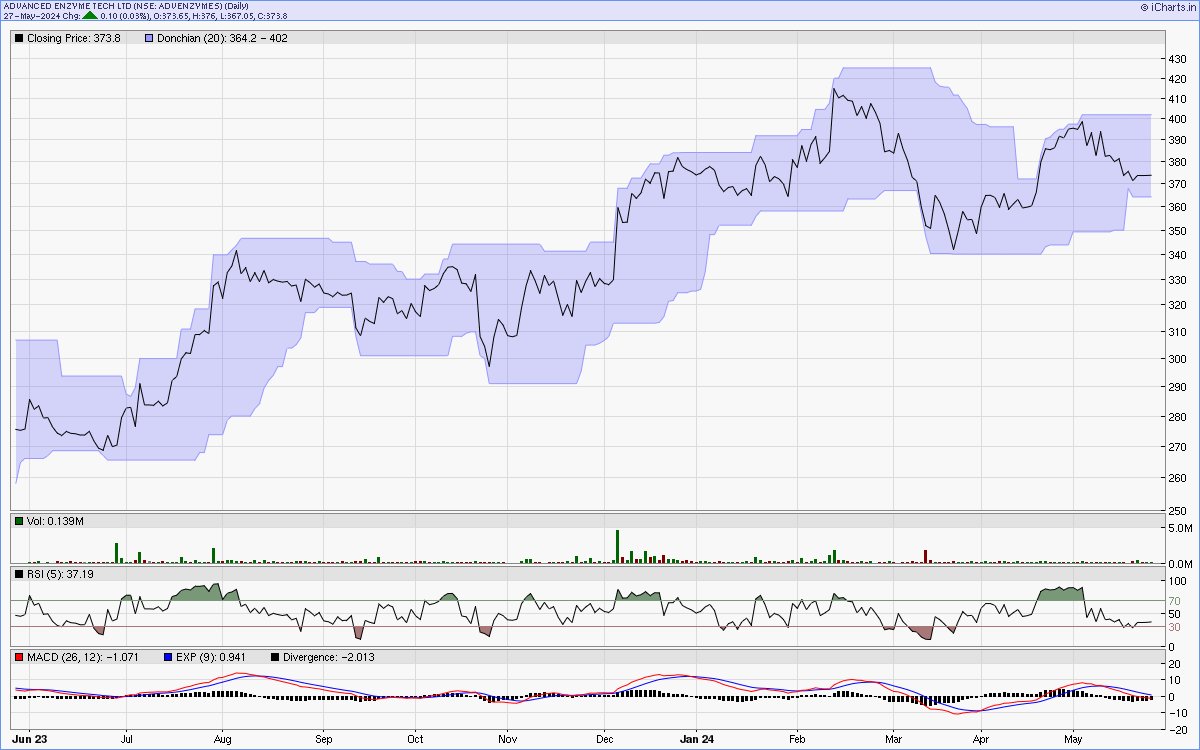
One year line chart
Two years weekly chart
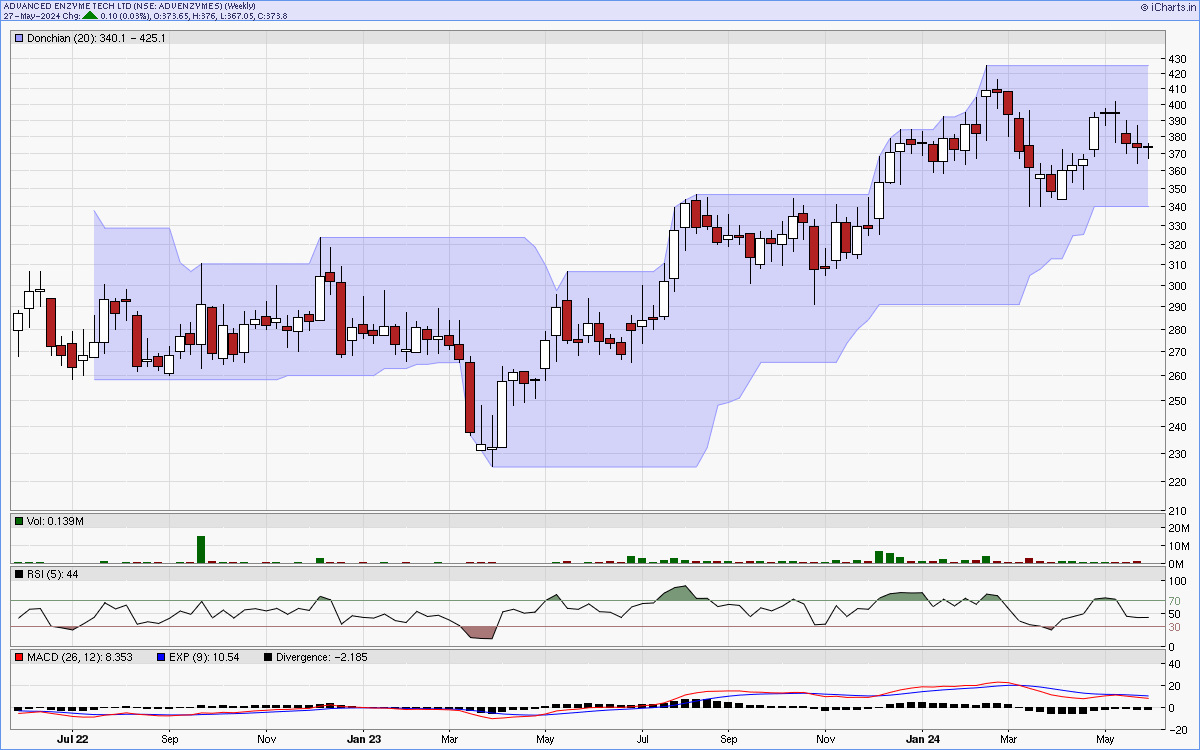
Charts courtsey: iCharts.in