Price / Percentage change:
| Open | High | Low | Close |
| Latest | 1845.00 | 1870.00 | 1821.25 | 1836.30 |
| Prev day | 1784.95 | 1821.00 | 1775.30 | 1808.85 |
| Last week | 1700.00 | 2008.45 | 1681.88 | 1788.85 |
| Last month | 1624.00 | 2008.45 | 1557.50 | 1782.15 |
| All time | | 2008.45 | 112.53 | |
| 1 Day | 5 Day | 20 Day | 50 Day |
| 1.50% | 1.00% | 16.50% | 34.00% |
Trading range:
| TradingRange | Highest
Close | Lowest
Close | Highest
High | Lowest
Low |
| 5 days | 1836.30 | 1777.35 | 1870.00 | 1761.10 |
| 10 days | 1836.30 | 1664.80 | 2008.45 | 1652.65 |
| 20 days | 1836.30 | 1610.60 | 2008.45 | 1590.00 |
Trend analysis :
| Trend | First Signal | Price | Reversal | P SAR |
| BBB | 18-03-2024 | 1557.47 | 1590.00 | 2003.79 |
| ATR (20d) | Williams R | RSI (5d) | RSI (14d) | Vol | Av Vol (20d) |
| 73.20 | 56 | 72 | 67 | 23000 | 40000
|
Fibonacci price projections:
| 0% | 61.8% | 100% | 161.8% | 261.8% |
| Up | 1725.60 | 1900.40 | 2008.45 | 2183.25 | 2466.10 |
| Dn | 2008.45 | 1833.65 | 1725.60 | 1550.80 | 1267.95 |
Intraday pivot levels:
| Sup 2 | Sup 1 | Pivot | Res 1 | Res 2 |
| 1793.75 | 1815.00 | 1842.50 | 1863.75 | 1891.25 |
Weekly pivot levels:
| Sup 2 | Sup 1 | Pivot | Res 1 | Res 2 |
| 1499.75 | 1644.20 | 1826.35 | 1970.80 | 2152.90 |
Monthly pivot levels:
| Sup 2 | Sup 1 | Pivot | Res 1 | Res 2 |
| 1331.75 | 1556.95 | 1782.70 | 2007.90 | 2233.65 |
Moving averages (simple):
| 5 Day | 20 Day | 50 Day | 200 Day |
| 1799 | 1732 | 1563 |
1294 |
Other levels:
| 52 Week Hi - Lo | Last Mnth Hi - Lo | Swing Hi - Lo | B Band Hi - Lo |
| 2008.45 - 565.28 | 2008.45 - 1557.50 | 2008.45 - 1725.60 | 1862.47 - 1602.02 |
|
Charts...
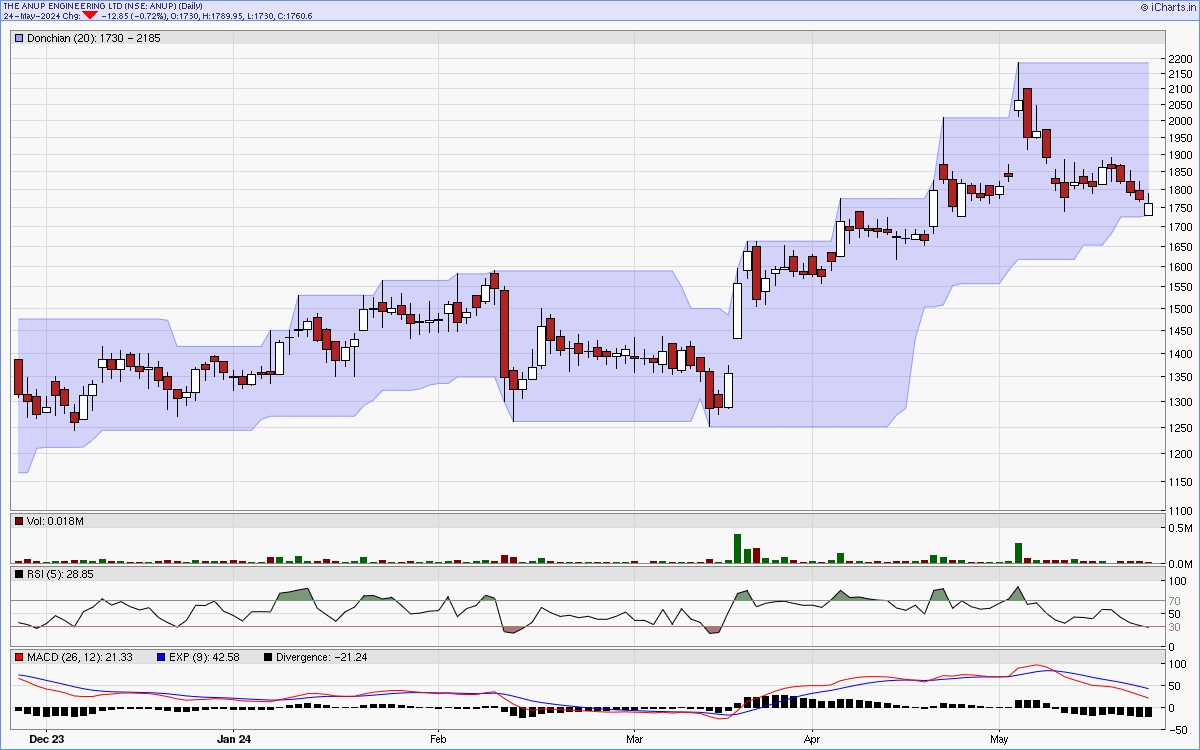
Six months candlestick chart
Charts courtsey: iCharts.in
One year line chart

Two years weekly chart
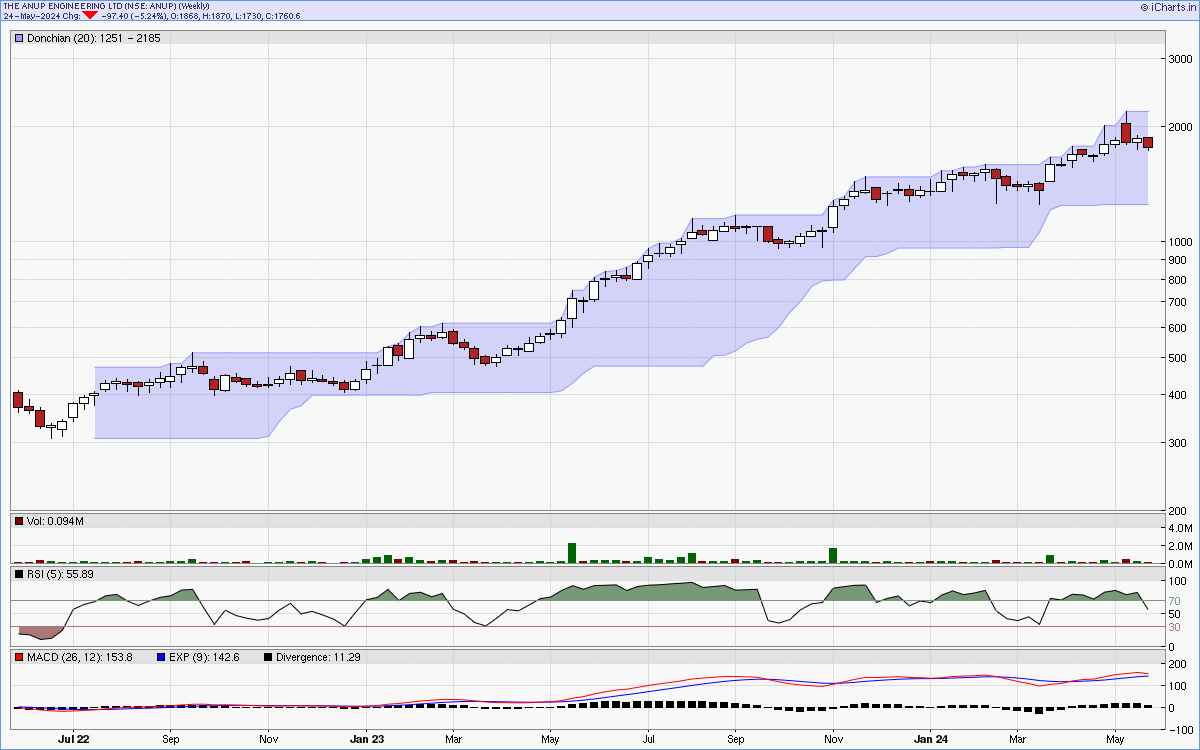
Charts courtsey: iCharts.in