Price / Percentage change:
| Open | High | Low | Close |
| Latest | 891.95 | 915.00 | 850.05 | 870.80 |
| Prev day | 821.00 | 920.00 | 804.15 | 886.50 |
| Last week | 777.20 | 903.80 | 777.20 | 822.65 |
| Last month | 582.90 | 903.80 | 582.55 | 823.05 |
| All time | | 925.45 | 11.75 | |
| 1 Day | 5 Day | 20 Day | 50 Day |
| -1.50% | 4.00% | 45.00% | 46.00% |
Trading range:
| TradingRange | Highest
Close | Lowest
Close | Highest
High | Lowest
Low |
| 5 days | 886.50 | 818.50 | 920.00 | 802.25 |
| 10 days | 886.50 | 764.00 | 920.00 | 735.00 |
| 20 days | 886.50 | 607.00 | 920.00 | 585.10 |
Trend analysis :
| Trend | First Signal | Price | Reversal | P SAR |
| BBB | 05-04-2024 | 717.40 | 585.10 | 733.70 |
| ATR (20d) | Williams R | RSI (5d) | RSI (14d) | Vol | Av Vol (20d) |
| 51.53 | 75 | 68 | 67 | 217000 | 334000
|
Fibonacci price projections:
| 0% | 61.8% | 100% | 161.8% | 261.8% |
| Up | 802.25 | 865.01 | 903.80 | 966.56 | 1068.11 |
| Dn | 903.80 | 841.04 | 802.25 | 739.49 | 637.94 |
Intraday pivot levels:
| Sup 2 | Sup 1 | Pivot | Res 1 | Res 2 |
| 813.65 | 842.20 | 878.60 | 907.15 | 943.55 |
Weekly pivot levels:
| Sup 2 | Sup 1 | Pivot | Res 1 | Res 2 |
| 707.95 | 765.30 | 834.55 | 891.85 | 961.10 |
Monthly pivot levels:
| Sup 2 | Sup 1 | Pivot | Res 1 | Res 2 |
| 448.50 | 635.70 | 769.75 | 956.95 | 1091.00 |
Moving averages (simple):
| 5 Day | 20 Day | 50 Day | 200 Day |
| 844 | 779 | 676 |
487 |
Other levels:
| 52 Week Hi - Lo | Last Mnth Hi - Lo | Swing Hi - Lo | B Band Hi - Lo |
| 920.00 - 307.85 | 903.80 - 582.55 | 903.80 - 802.25 | 925.76 - 632.22 |
|
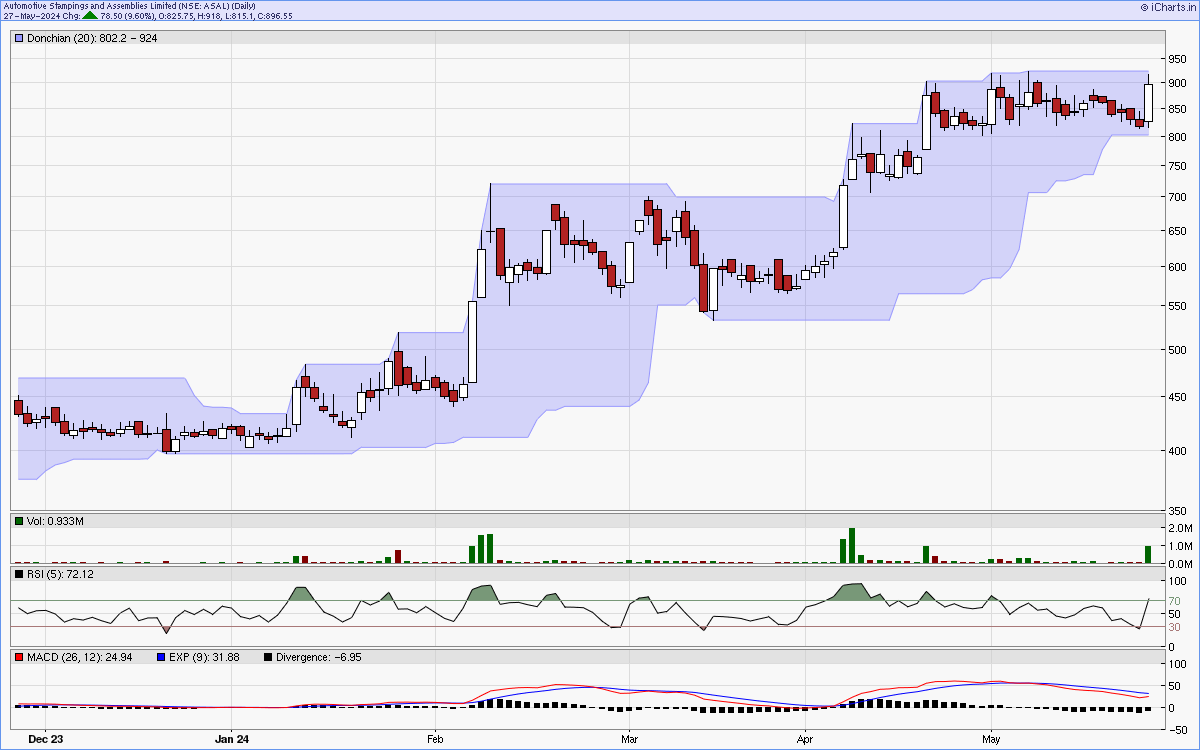
Charts...
Six months candlestick chart
Charts courtsey: iCharts.in
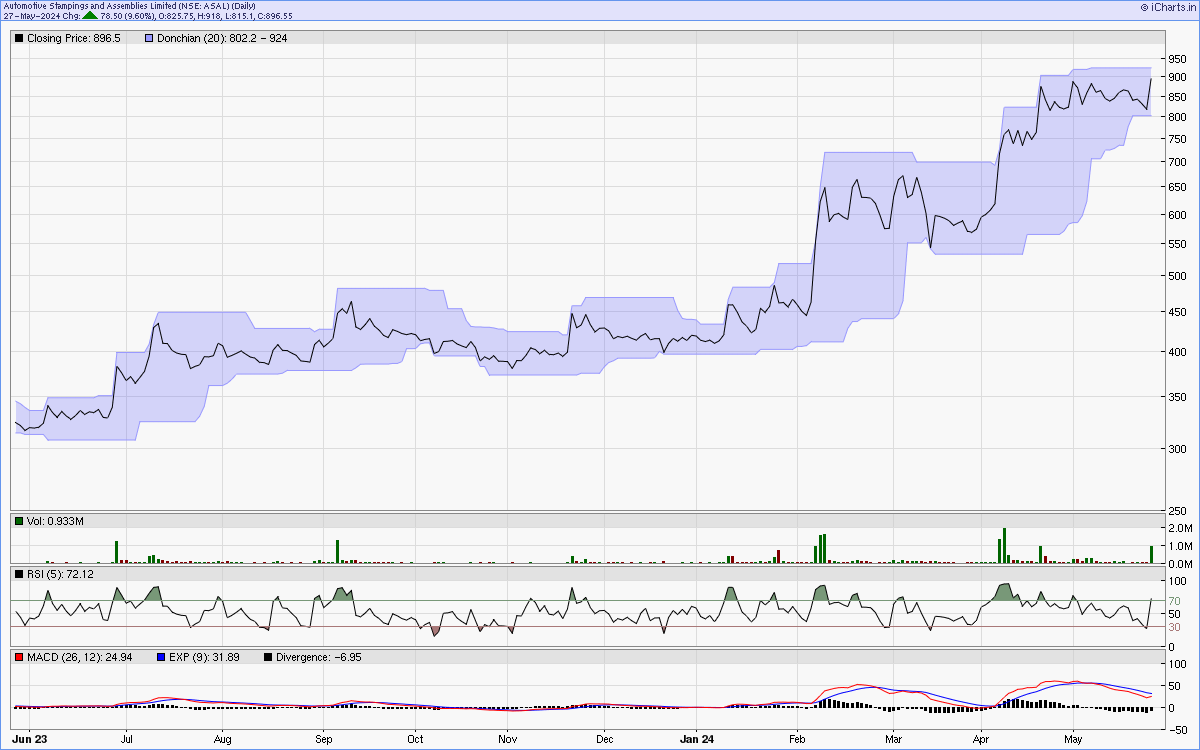
One year line chart
Two years weekly chart
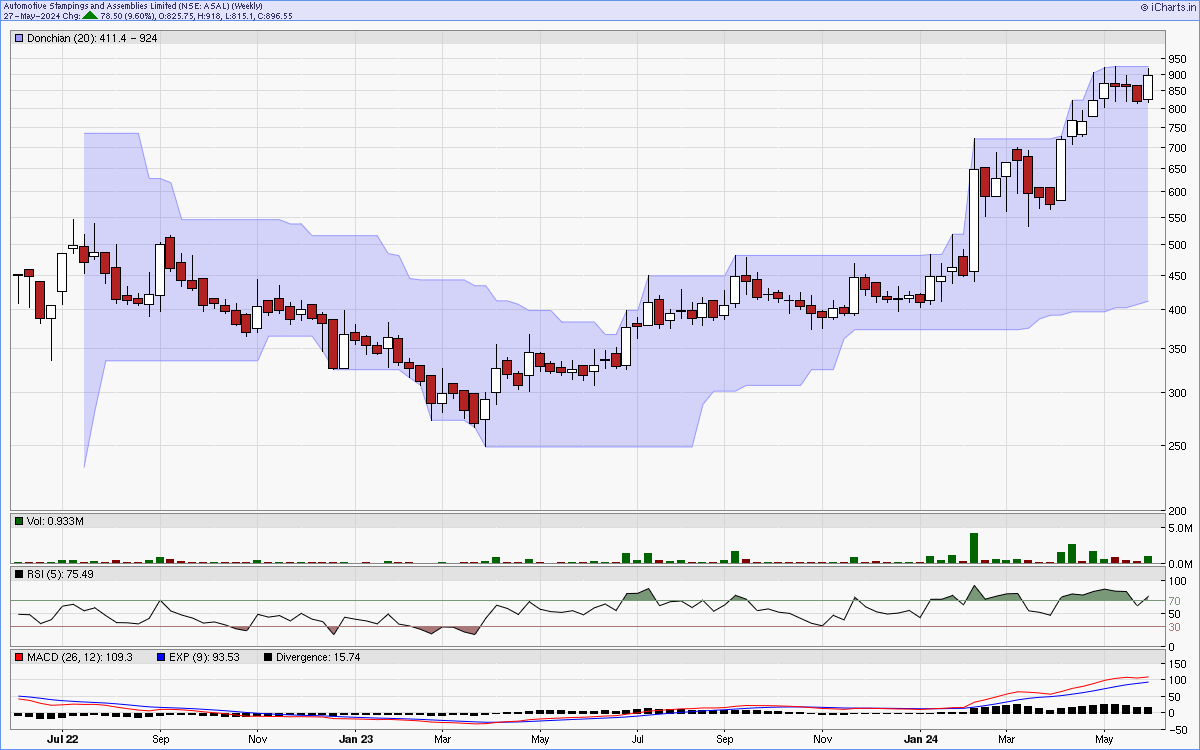
Charts courtsey: iCharts.in