Price / Percentage change:
| Open | High | Low | Close |
| Latest | 694.35 | 700.60 | 666.00 | 680.85 |
| Prev day | 697.00 | 702.85 | 686.15 | 688.60 |
| Last week | 700.90 | 729.25 | 693.00 | 710.50 |
| Last month | 604.70 | 729.25 | 604.70 | 697.10 |
| All time | | 729.25 | 21.97 | |
| 1 Day | 5 Day | 20 Day | 50 Day |
| -1.00% | -4.50% | 9.00% | 6.50% |
Trading range:
| TradingRange | Highest
Close | Lowest
Close | Highest
High | Lowest
Low |
| 5 days | 710.50 | 680.85 | 724.20 | 666.00 |
| 10 days | 715.20 | 680.85 | 729.25 | 666.00 |
| 20 days | 715.20 | 633.35 | 729.25 | 621.40 |
Trend analysis :
| Trend | First Signal | Price | Reversal | P SAR |
| BBB | 09-04-2024 | 655.40 | 621.40 | 724.59 |
| ATR (20d) | Williams R | RSI (5d) | RSI (14d) | Vol | Av Vol (20d) |
| 24.89 | 46 | 30 | 56 | 288000 | 357000
|
Fibonacci price projections:
| 0% | 61.8% | 100% | 161.8% | 261.8% |
| Up | 530.00 | 653.14 | 729.25 | 852.39 | 1051.64 |
| Dn | 729.25 | 606.11 | 530.00 | 406.86 | 207.61 |
Intraday pivot levels:
| Sup 2 | Sup 1 | Pivot | Res 1 | Res 2 |
| 647.85 | 664.30 | 682.45 | 698.90 | 717.05 |
Weekly pivot levels:
| Sup 2 | Sup 1 | Pivot | Res 1 | Res 2 |
| 674.65 | 692.55 | 710.90 | 728.80 | 747.15 |
Monthly pivot levels:
| Sup 2 | Sup 1 | Pivot | Res 1 | Res 2 |
| 552.45 | 624.75 | 677.00 | 749.30 | 801.55 |
Moving averages (simple):
| 5 Day | 20 Day | 50 Day | 200 Day |
| 695 | 679 | 632 |
525 |
Other levels:
| 52 Week Hi - Lo | Last Mnth Hi - Lo | Swing Hi - Lo | B Band Hi - Lo |
| 729.25 - 304.95 | 729.25 - 604.70 | 729.25 - 530.00 | 734.11 - 623.33 |
|
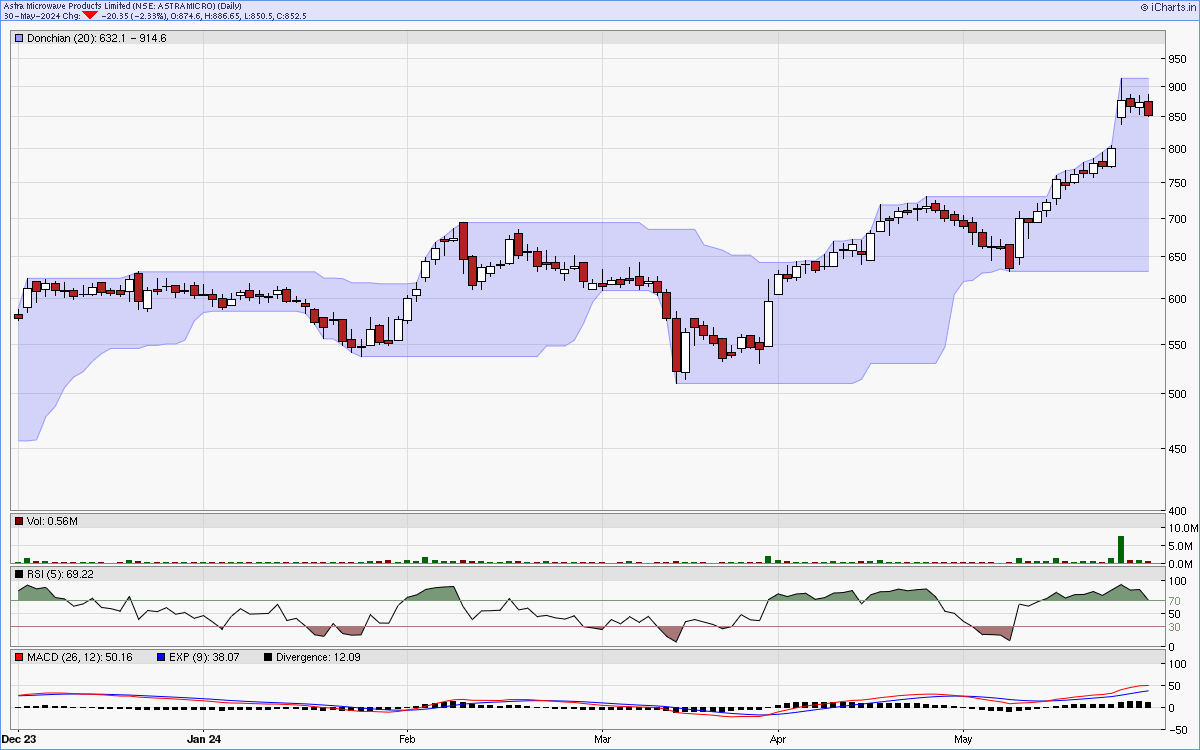
Charts...
Six months candlestick chart
Charts courtsey: iCharts.in
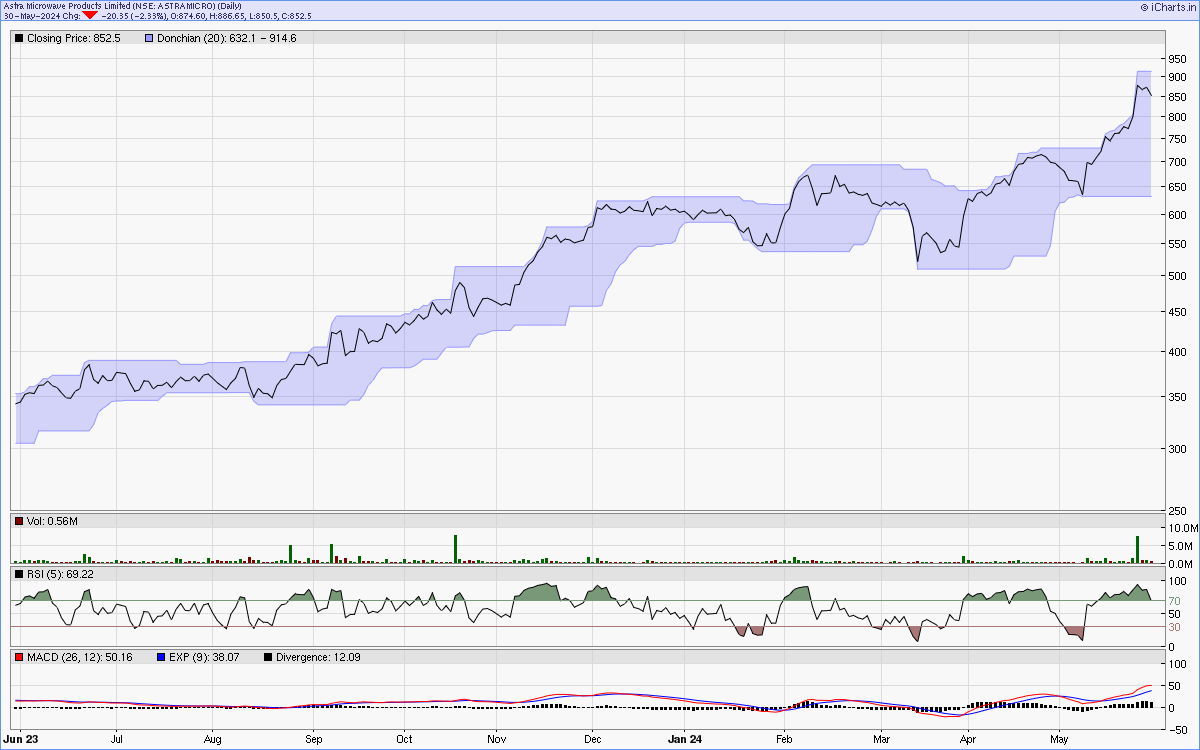
One year line chart
Two years weekly chart
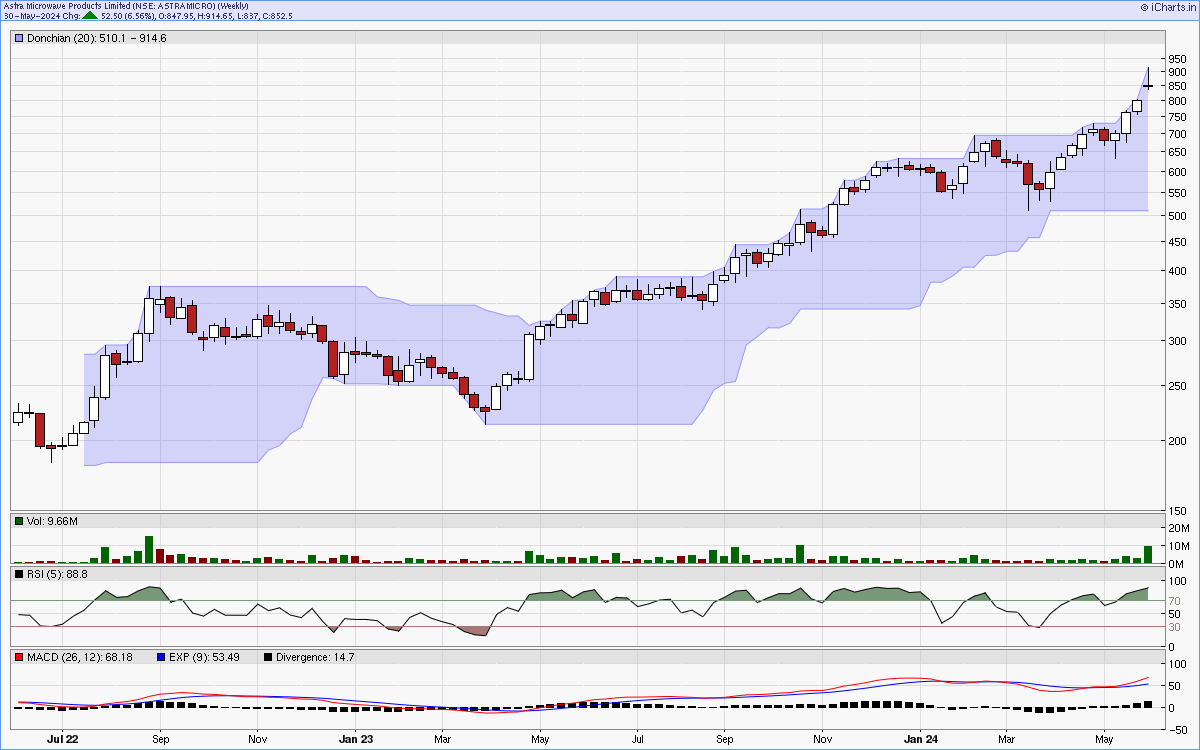
Charts courtsey: iCharts.in