Price / Percentage change:
| Open | High | Low | Close |
| Latest | 1369.15 | 1374.80 | 1351.00 | 1354.25 |
| Prev day | 1366.00 | 1373.50 | 1358.00 | 1369.15 |
| Last week | 1339.90 | 1387.95 | 1323.75 | 1363.40 |
| Last month | 1366.30 | 1404.40 | 1307.05 | 1369.15 |
| All time | | 2262.00 | 12.68 | |
| 1 Day | 5 Day | 20 Day | 50 Day |
| -1.00% | -0.50% | -1.00% | -4.00% |
Trading range:
| TradingRange | Highest
Close | Lowest
Close | Highest
High | Lowest
Low |
| 5 days | 1369.15 | 1349.45 | 1387.95 | 1345.25 |
| 10 days | 1369.15 | 1320.40 | 1387.95 | 1307.05 |
| 20 days | 1387.50 | 1320.40 | 1404.40 | 1307.05 |
Trend analysis :
| Trend | First Signal | Price | Reversal | P SAR |
| SSS | 09-01-2024 | 1569.20 | 1404.40 | 1311.81 |
| ATR (20d) | Williams R | RSI (5d) | RSI (14d) | Vol | Av Vol (20d) |
| 27.52 | 48 | 48 | 46 | 299000 | 554000
|
Fibonacci price projections:
| 0% | 61.8% | 100% | 161.8% | 261.8% |
| Up | 1307.05 | 1410.13 | 1473.85 | 1576.93 | 1743.73 |
| Dn | 1473.85 | 1370.77 | 1307.05 | 1203.97 | 1037.17 |
Intraday pivot levels:
| Sup 2 | Sup 1 | Pivot | Res 1 | Res 2 |
| 1336.20 | 1345.20 | 1360.00 | 1369.00 | 1383.80 |
Weekly pivot levels:
| Sup 2 | Sup 1 | Pivot | Res 1 | Res 2 |
| 1294.10 | 1328.70 | 1358.35 | 1392.90 | 1422.55 |
Monthly pivot levels:
| Sup 2 | Sup 1 | Pivot | Res 1 | Res 2 |
| 1262.85 | 1316.00 | 1360.20 | 1413.35 | 1457.55 |
Moving averages (simple):
| 5 Day | 20 Day | 50 Day | 200 Day |
| 1359 | 1356 | 1389 |
1562 |
Other levels:
| 52 Week Hi - Lo | Last Mnth Hi - Lo | Swing Hi - Lo | B Band Hi - Lo |
| 1771.45 - 1307.05 | 1404.40 - 1307.05 | 1473.85 - 1307.05 | 1388.12 - 1324.71 |
|
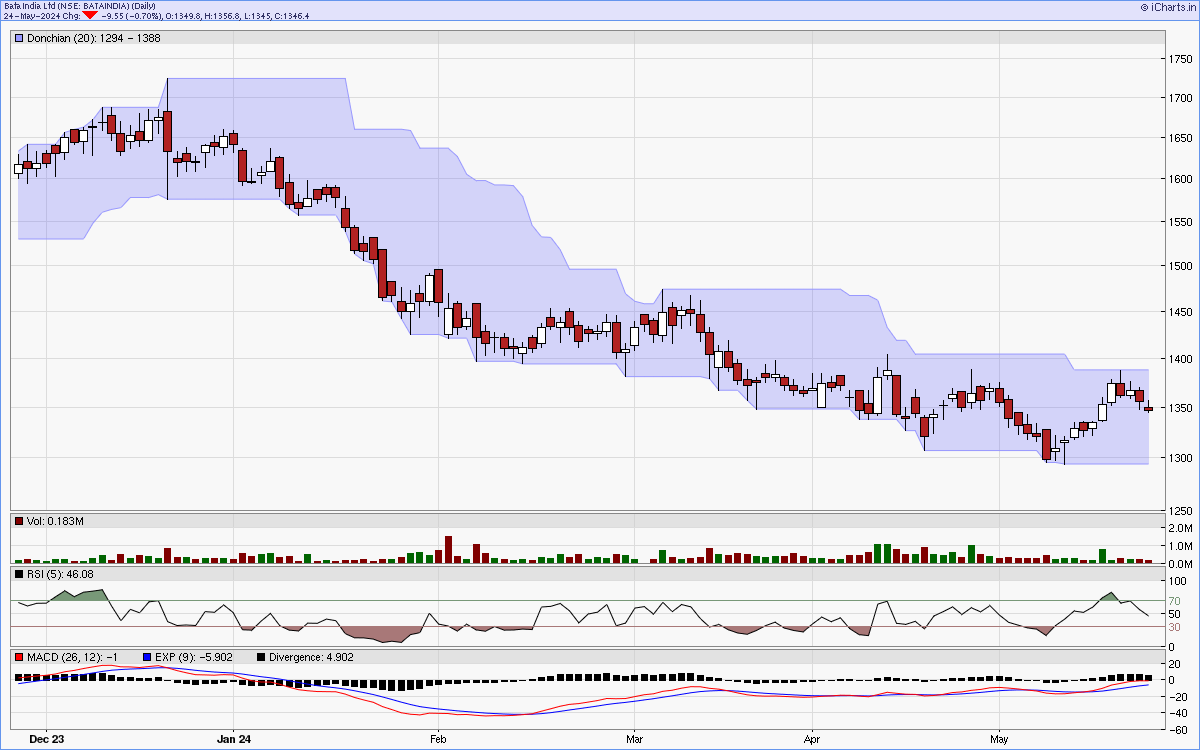
Charts...
Six months candlestick chart
Charts courtsey: iCharts.in
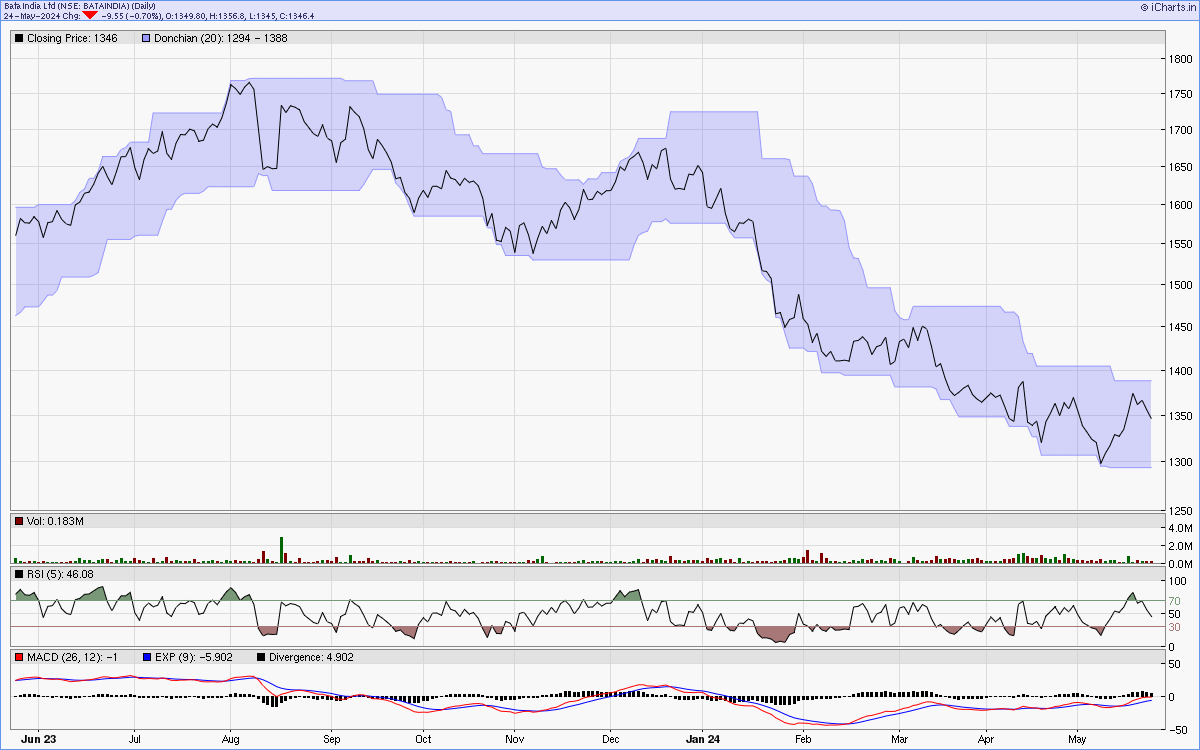
One year line chart
Two years weekly chart
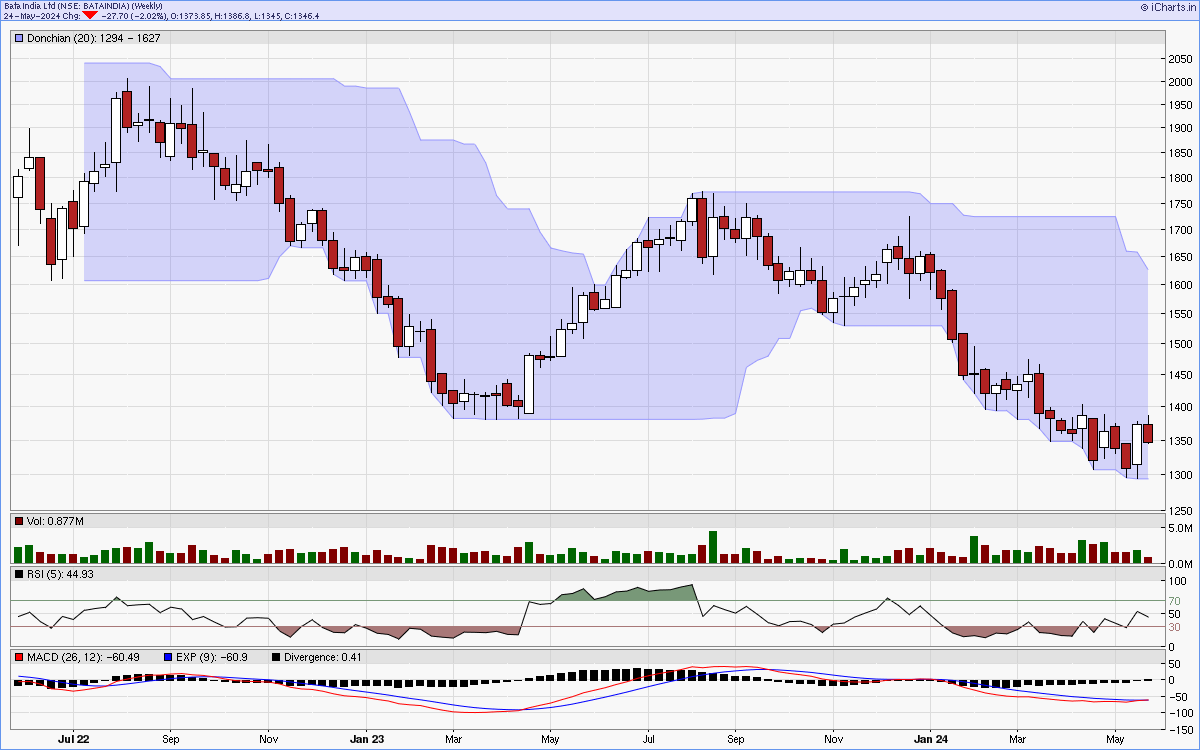
Charts courtsey: iCharts.in