Price / Percentage change:
| Open | High | Low | Close |
| Latest | 580.80 | 584.50 | 557.50 | 560.00 |
| Prev day | 586.30 | 605.00 | 575.50 | 579.20 |
| Last week | 528.60 | 614.80 | 528.60 | 570.65 |
| Last month | 520.95 | 614.80 | 510.55 | 585.05 |
| All time | | 1178.45 | 27.30 | |
| 1 Day | 5 Day | 20 Day | 50 Day |
| -3.00% | -2.50% | 0.50% | 5.00% |
Trading range:
| TradingRange | Highest
Close | Lowest
Close | Highest
High | Lowest
Low |
| 5 days | 585.05 | 560.00 | 613.00 | 557.50 |
| 10 days | 585.05 | 520.80 | 614.80 | 510.55 |
| 20 days | 585.05 | 519.20 | 614.80 | 510.55 |
Trend analysis :
| Trend | First Signal | Price | Reversal | P SAR |
| BBB | 22-04-2024 | 582.90 | 510.55 | 524.30 |
| ATR (20d) | Williams R | RSI (5d) | RSI (14d) | Vol | Av Vol (20d) |
| 26.54 | 47 | 43 | 51 | 109000 | 131000
|
Fibonacci price projections:
| 0% | 61.8% | 100% | 161.8% | 261.8% |
| Up | 510.55 | 573.86 | 613.00 | 676.31 | 778.76 |
| Dn | 613.00 | 549.69 | 510.55 | 447.24 | 344.79 |
Intraday pivot levels:
| Sup 2 | Sup 1 | Pivot | Res 1 | Res 2 |
| 540.30 | 550.05 | 567.30 | 577.05 | 594.30 |
Weekly pivot levels:
| Sup 2 | Sup 1 | Pivot | Res 1 | Res 2 |
| 485.15 | 527.90 | 571.35 | 614.10 | 657.55 |
Monthly pivot levels:
| Sup 2 | Sup 1 | Pivot | Res 1 | Res 2 |
| 465.85 | 525.40 | 570.10 | 629.65 | 674.30 |
Moving averages (simple):
| 5 Day | 20 Day | 50 Day | 200 Day |
| 571 | 556 | 555 |
511 |
Other levels:
| 52 Week Hi - Lo | Last Mnth Hi - Lo | Swing Hi - Lo | B Band Hi - Lo |
| 650.00 - 368.00 | 614.80 - 510.55 | 613.00 - 510.55 | 600.25 - 511.40 |
|
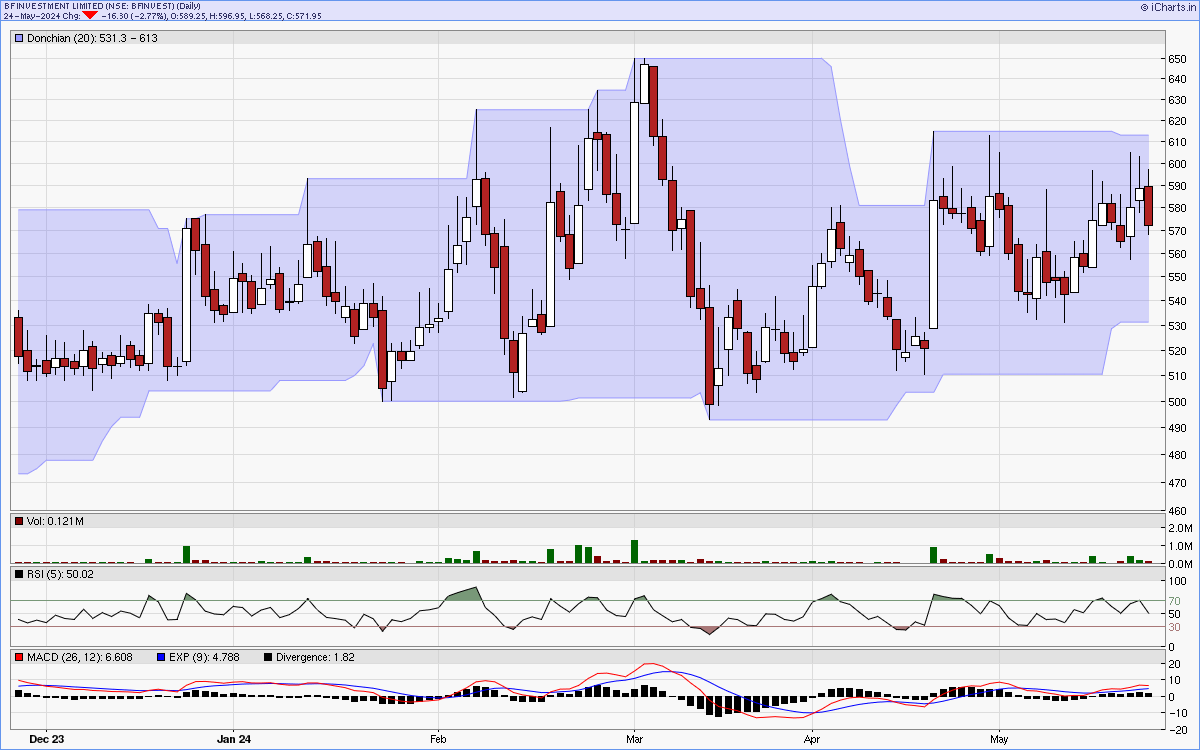
Charts...
Six months candlestick chart
Charts courtsey: iCharts.in
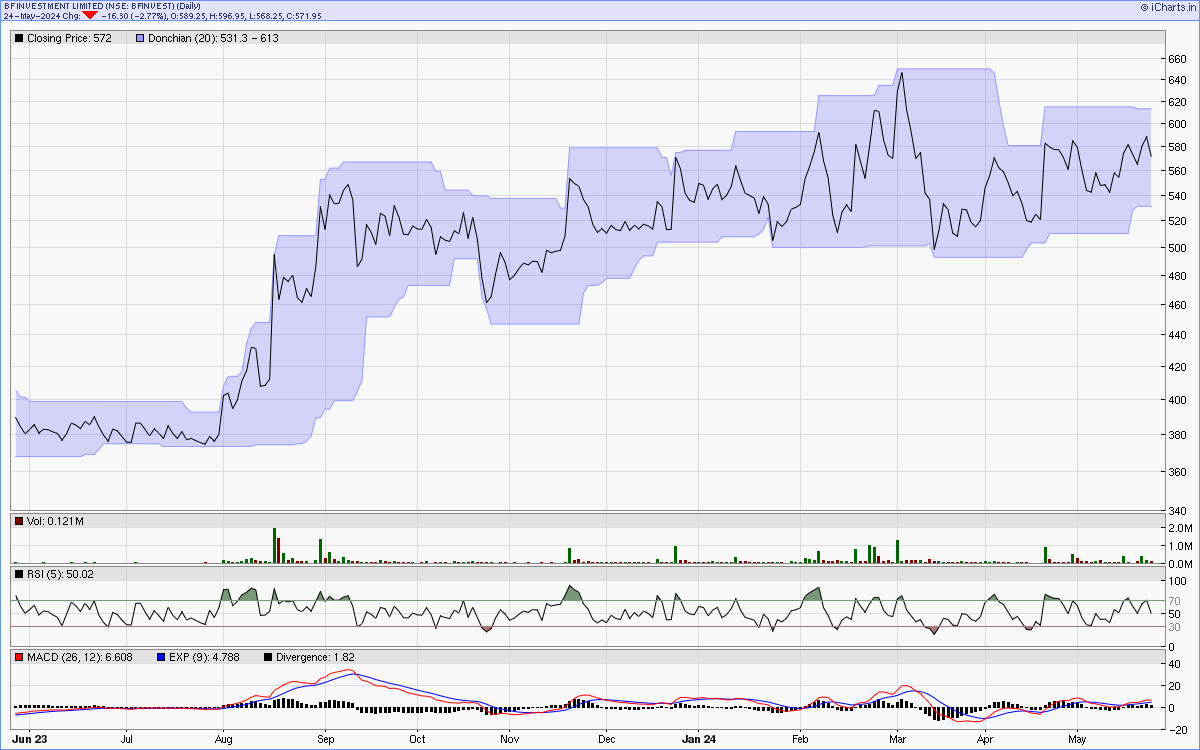
One year line chart
Two years weekly chart
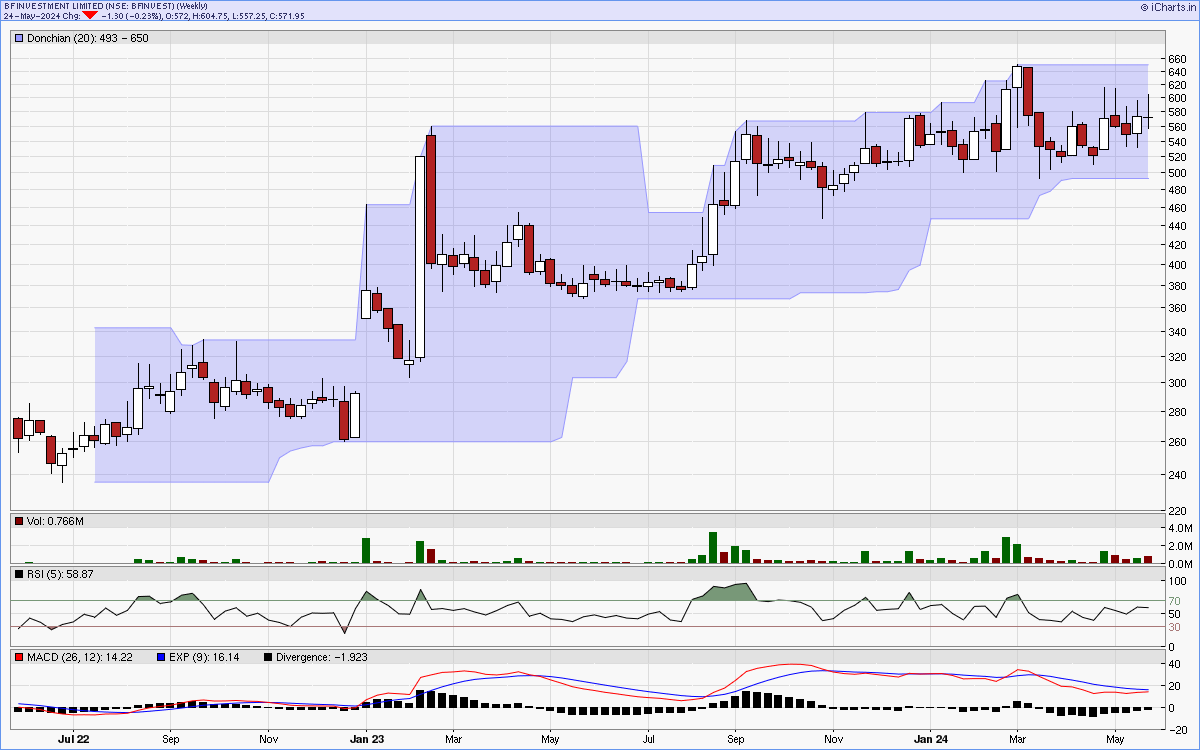
Charts courtsey: iCharts.in