Price / Percentage change:
| Open | High | Low | Close |
| Latest | 1274.90 | 1280.95 | 1242.20 | 1252.20 |
| Prev day | 1271.50 | 1285.00 | 1262.80 | 1274.25 |
| Last week | 1205.85 | 1326.00 | 1194.75 | 1309.90 |
| Last month | 1132.20 | 1326.00 | 1105.30 | 1271.20 |
| All time | | 1330.00 | 207.50 | |
| 1 Day | 5 Day | 20 Day | 50 Day |
| -1.50% | -4.50% | 8.00% | 12.50% |
Trading range:
| TradingRange | Highest
Close | Lowest
Close | Highest
High | Lowest
Low |
| 5 days | 1309.90 | 1252.20 | 1326.00 | 1242.20 |
| 10 days | 1311.85 | 1193.10 | 1326.00 | 1158.10 |
| 20 days | 1311.85 | 1141.75 | 1326.00 | 1105.30 |
Trend analysis :
| Trend | First Signal | Price | Reversal | P SAR |
| BBB | 22-04-2024 | 1204.50 | 1105.30 | 1226.47 |
| ATR (20d) | Williams R | RSI (5d) | RSI (14d) | Vol | Av Vol (20d) |
| 34.39 | 57 | 49 | 60 | 684000 | 1417000
|
Fibonacci price projections:
| 0% | 61.8% | 100% | 161.8% | 261.8% |
| Up | 1088.00 | 1235.08 | 1326.00 | 1473.08 | 1711.08 |
| Dn | 1326.00 | 1178.92 | 1088.00 | 940.92 | 702.92 |
Intraday pivot levels:
| Sup 2 | Sup 1 | Pivot | Res 1 | Res 2 |
| 1219.70 | 1235.95 | 1258.45 | 1274.70 | 1297.20 |
Weekly pivot levels:
| Sup 2 | Sup 1 | Pivot | Res 1 | Res 2 |
| 1145.60 | 1227.65 | 1276.85 | 1358.90 | 1408.10 |
Monthly pivot levels:
| Sup 2 | Sup 1 | Pivot | Res 1 | Res 2 |
| 1013.45 | 1142.30 | 1234.15 | 1363.00 | 1454.85 |
Moving averages (simple):
| 5 Day | 20 Day | 50 Day | 200 Day |
| 1278 | 1209 | 1168 |
1112 |
Other levels:
| 52 Week Hi - Lo | Last Mnth Hi - Lo | Swing Hi - Lo | B Band Hi - Lo |
| 1330.00 - 752.85 | 1326.00 - 1105.30 | 1326.00 - 1088.00 | 1316.95 - 1100.30 |
|
Charts...
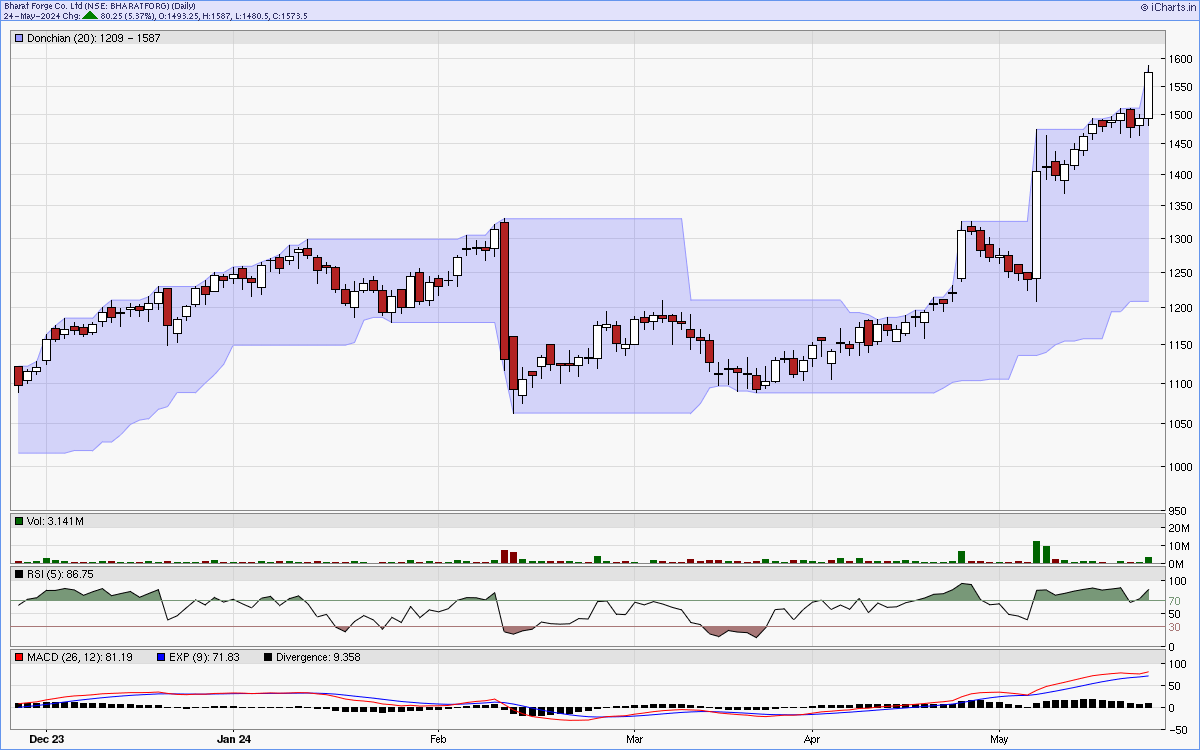
Six months candlestick chart
Charts courtsey: iCharts.in
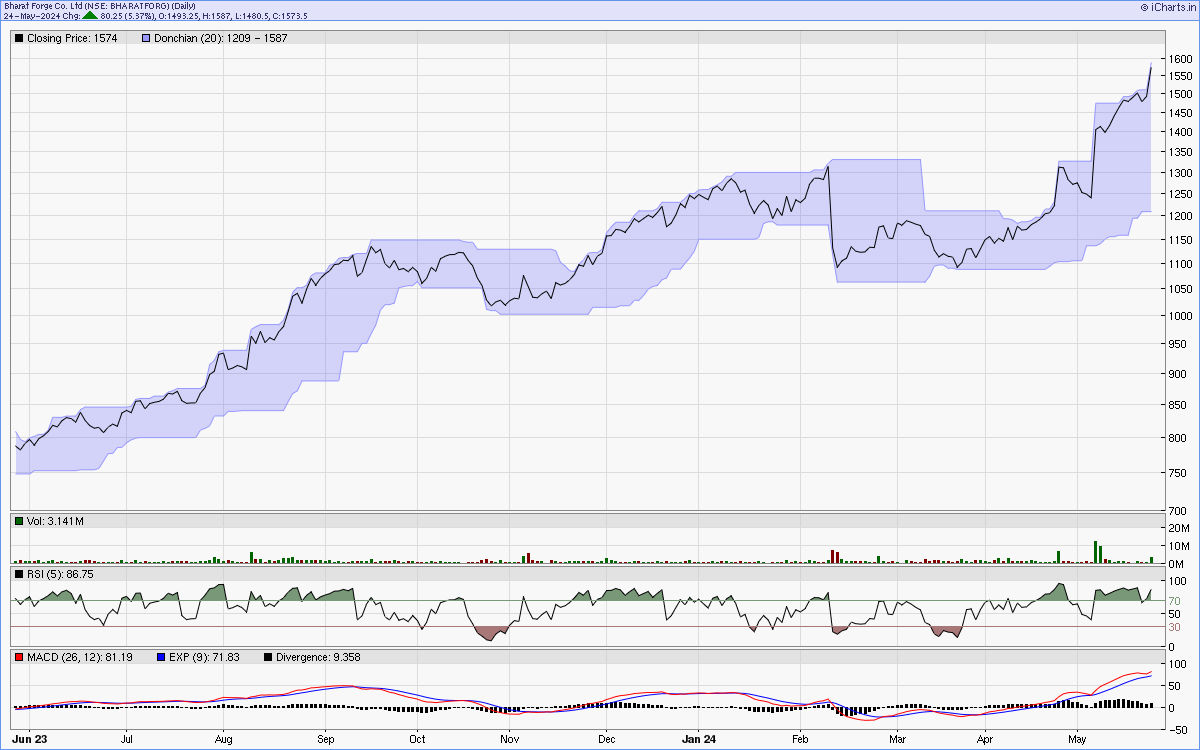
One year line chart
Two years weekly chart
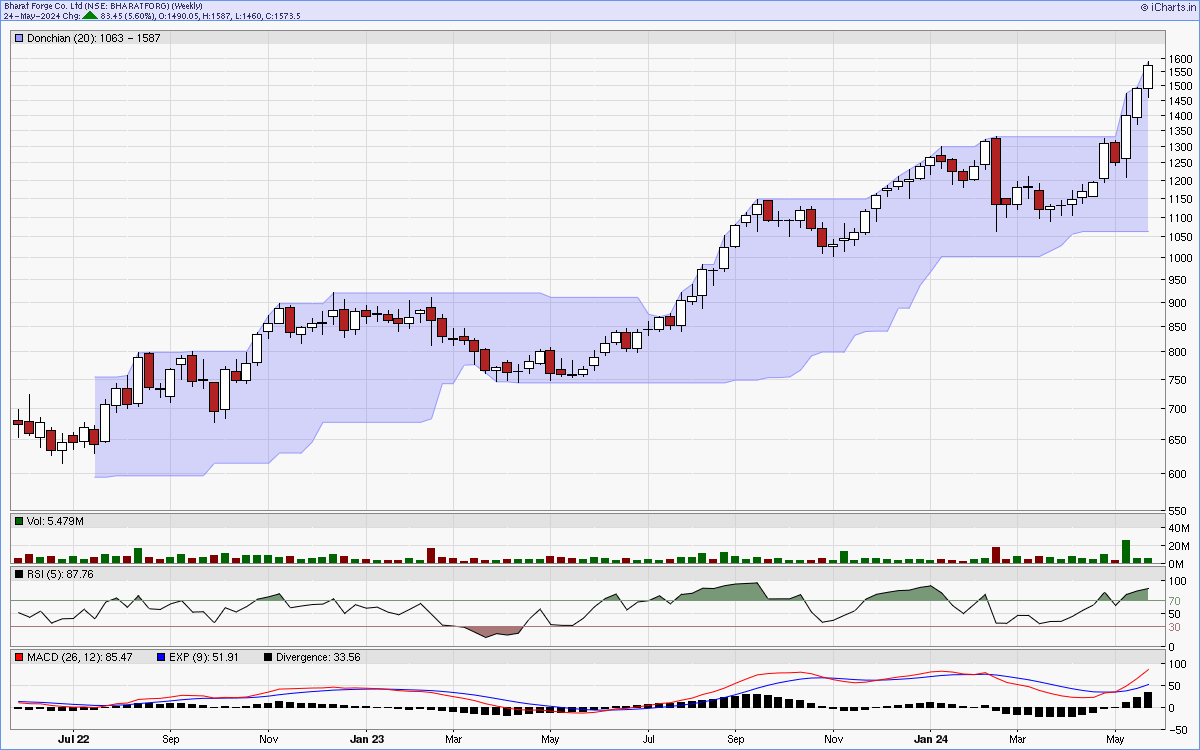
Charts courtsey: iCharts.in