Price / Percentage change:
| Open | High | Low | Close |
| Latest | 105.90 | 107.70 | 101.70 | 103.80 |
| Prev day | 106.20 | 106.30 | 104.40 | 105.50 |
| Last week | 108.10 | 114.05 | 108.10 | 108.60 |
| Last month | 90.00 | 114.05 | 90.00 | 106.20 |
| All time | | 230.80 | 33.00 | |
| 1 Day | 5 Day | 20 Day | 50 Day |
| -1.50% | -5.00% | 8.50% | -7.50% |
Trading range:
| TradingRange | Highest
Close | Lowest
Close | Highest
High | Lowest
Low |
| 5 days | 108.60 | 103.80 | 110.75 | 101.70 |
| 10 days | 111.60 | 103.80 | 114.05 | 101.70 |
| 20 days | 111.60 | 98.95 | 114.05 | 95.00 |
Trend analysis :
| Trend | First Signal | Price | Reversal | P SAR |
| BBB | 22-04-2024 | 110.95 | 95.00 | 113.02 |
| ATR (20d) | Williams R | RSI (5d) | RSI (14d) | Vol | Av Vol (20d) |
| 4.57 | 22 | 22 | 44 | 631000 | 1181000
|
Fibonacci price projections:
| 0% | 61.8% | 100% | 161.8% | 261.8% |
| Up | 100.85 | 109.01 | 114.05 | 122.21 | 135.41 |
| Dn | 114.05 | 105.89 | 100.85 | 92.69 | 79.49 |
Intraday pivot levels:
| Sup 2 | Sup 1 | Pivot | Res 1 | Res 2 |
| 98.40 | 101.10 | 104.40 | 107.10 | 110.40 |
Weekly pivot levels:
| Sup 2 | Sup 1 | Pivot | Res 1 | Res 2 |
| 104.30 | 106.45 | 110.25 | 112.40 | 116.20 |
Monthly pivot levels:
| Sup 2 | Sup 1 | Pivot | Res 1 | Res 2 |
| 79.35 | 92.75 | 103.40 | 116.80 | 127.45 |
Moving averages (simple):
| 5 Day | 20 Day | 50 Day | 200 Day |
| 106 | 107 | 108 |
137 |
Other levels:
| 52 Week Hi - Lo | Last Mnth Hi - Lo | Swing Hi - Lo | B Band Hi - Lo |
| 186.35 - 88.35 | 114.05 - 90.00 | 114.05 - 100.85 | 113.12 - 100.13 |
|
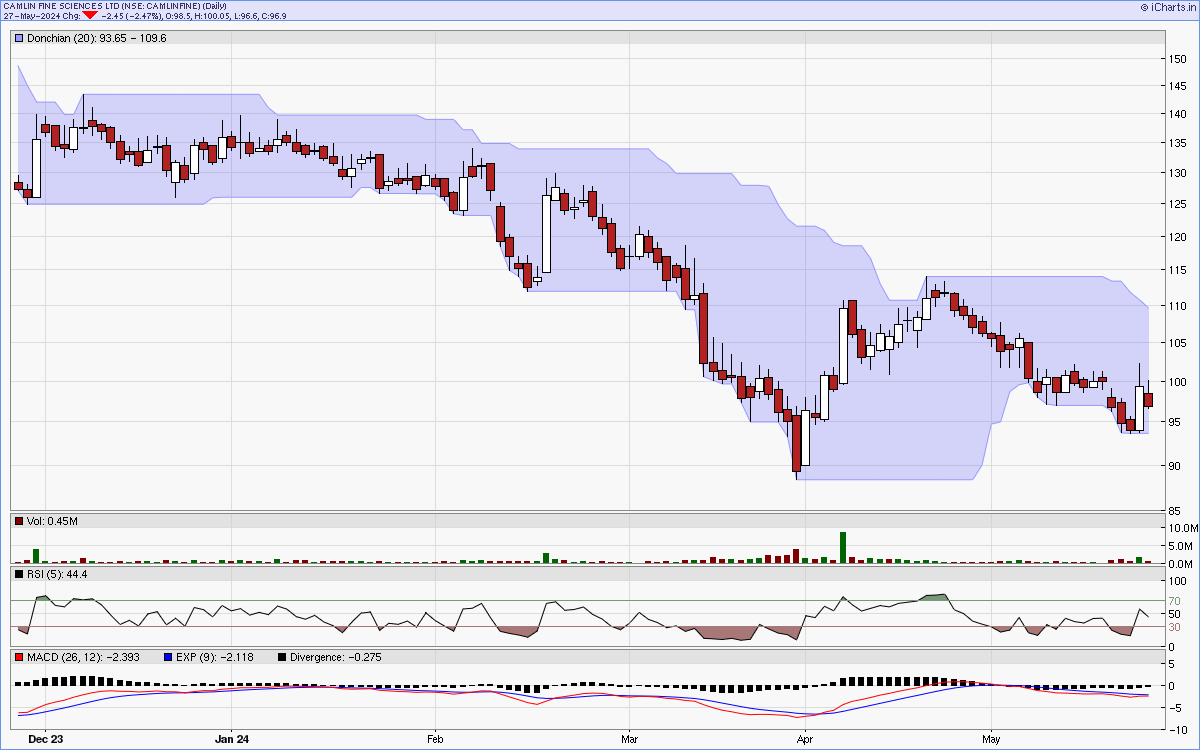
Charts...
Six months candlestick chart
Charts courtsey: iCharts.in
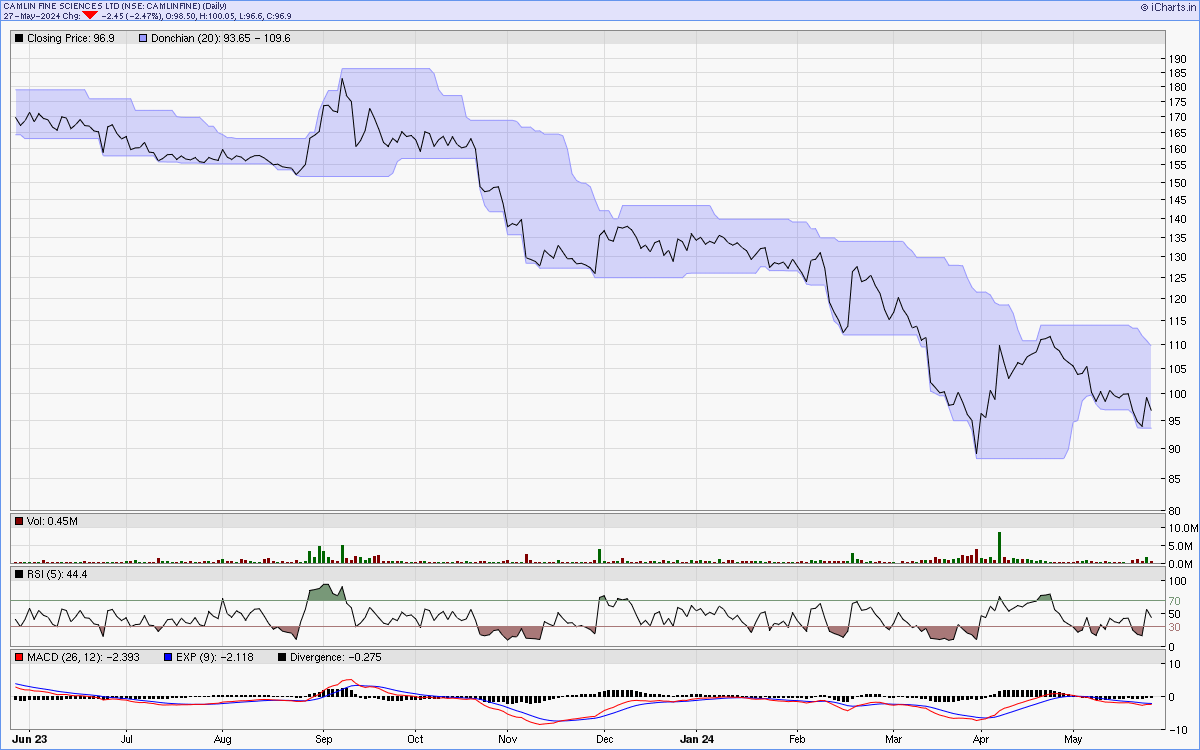
One year line chart
Two years weekly chart
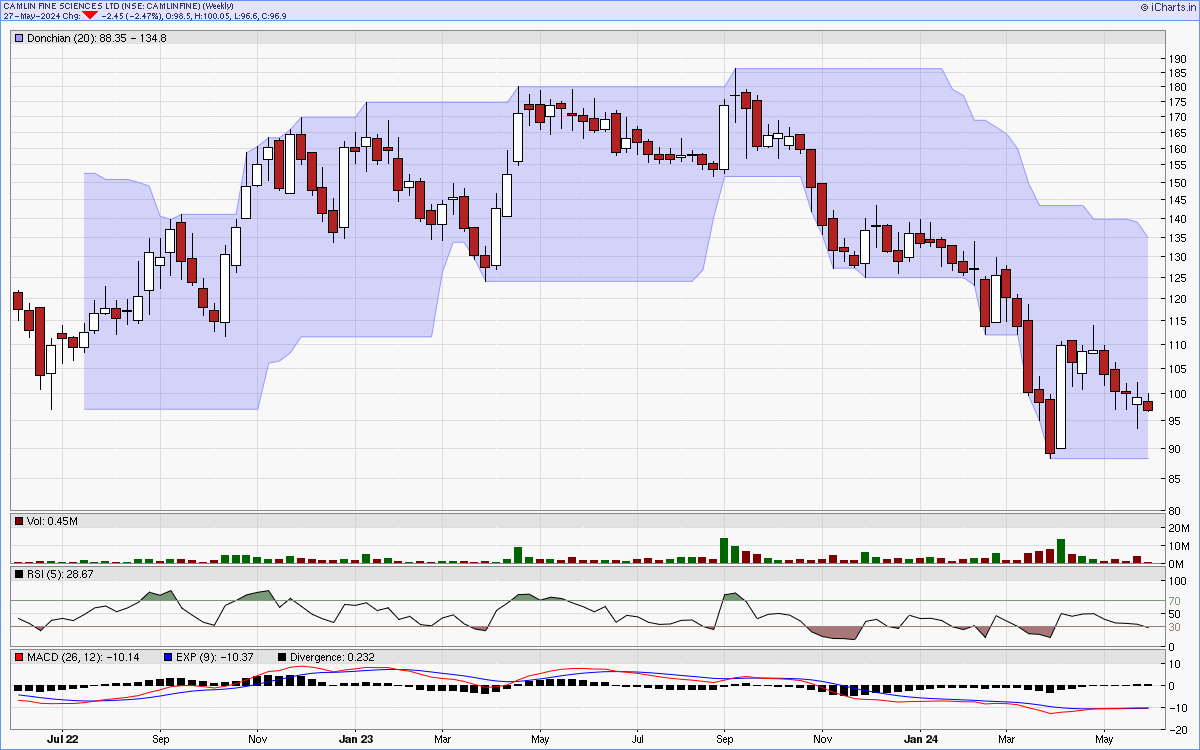
Charts courtsey: iCharts.in