Price / Percentage change:
| Open | High | Low | Close |
| Latest | 922.25 | 936.95 | 906.30 | 931.20 |
| Prev day | 920.05 | 924.45 | 905.25 | 910.90 |
| Last week | 934.00 | 938.85 | 896.30 | 910.90 |
| Last month | 774.95 | 963.80 | 774.05 | 904.80 |
| All time | | 963.80 | 711.20 | |
| 1 Day | 5 Day | 20 Day | 50 Day |
| 2.00% | 0.00% | 17.00% | 11.50% |
Trading range:
| TradingRange | Highest
Close | Lowest
Close | Highest
High | Lowest
Low |
| 5 days | 931.20 | 904.80 | 938.85 | 896.30 |
| 10 days | 949.90 | 882.15 | 963.80 | 853.30 |
| 20 days | 949.90 | 810.35 | 963.80 | 784.95 |
Trend analysis :
| Trend | First Signal | Price | Reversal | P SAR |
| BBB | 10-04-2024 | 832.05 | 784.95 | 959.83 |
| ATR (20d) | Williams R | RSI (5d) | RSI (14d) | Vol | Av Vol (20d) |
| 30.68 | 80 | 67 | 67 | 261000 | 373000
|
Fibonacci price projections:
| 0% | 61.8% | 100% | 161.8% | 261.8% |
| Up | 711.20 | 867.31 | 963.80 | 1119.91 | 1372.51 |
| Dn | 963.80 | 807.69 | 711.20 | 555.09 | 302.49 |
Intraday pivot levels:
| Sup 2 | Sup 1 | Pivot | Res 1 | Res 2 |
| 894.10 | 912.60 | 924.80 | 943.30 | 955.45 |
Weekly pivot levels:
| Sup 2 | Sup 1 | Pivot | Res 1 | Res 2 |
| 872.80 | 891.85 | 915.35 | 934.40 | 957.90 |
Monthly pivot levels:
| Sup 2 | Sup 1 | Pivot | Res 1 | Res 2 |
| 691.10 | 797.90 | 880.85 | 987.65 | 1070.60 |
Moving averages (simple):
| 5 Day | 20 Day | 50 Day | 200 Day |
| 919 | 875 | 830 |
|
Other levels:
| 52 Week Hi - Lo | Last Mnth Hi - Lo | Swing Hi - Lo | B Band Hi - Lo |
| 963.80 - 711.20 | 963.80 - 774.05 | 963.80 - 711.20 | 967.61 - 782.03 |
|
Charts...
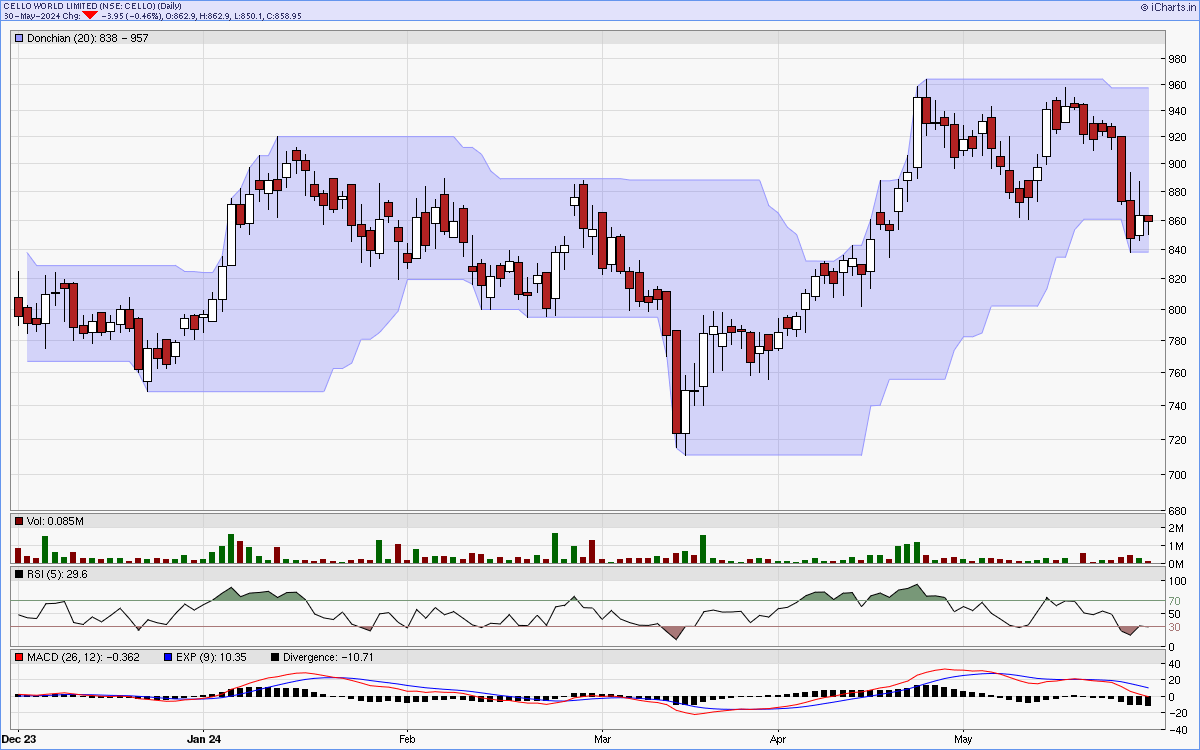
Six months candlestick chart
Charts courtsey: iCharts.in
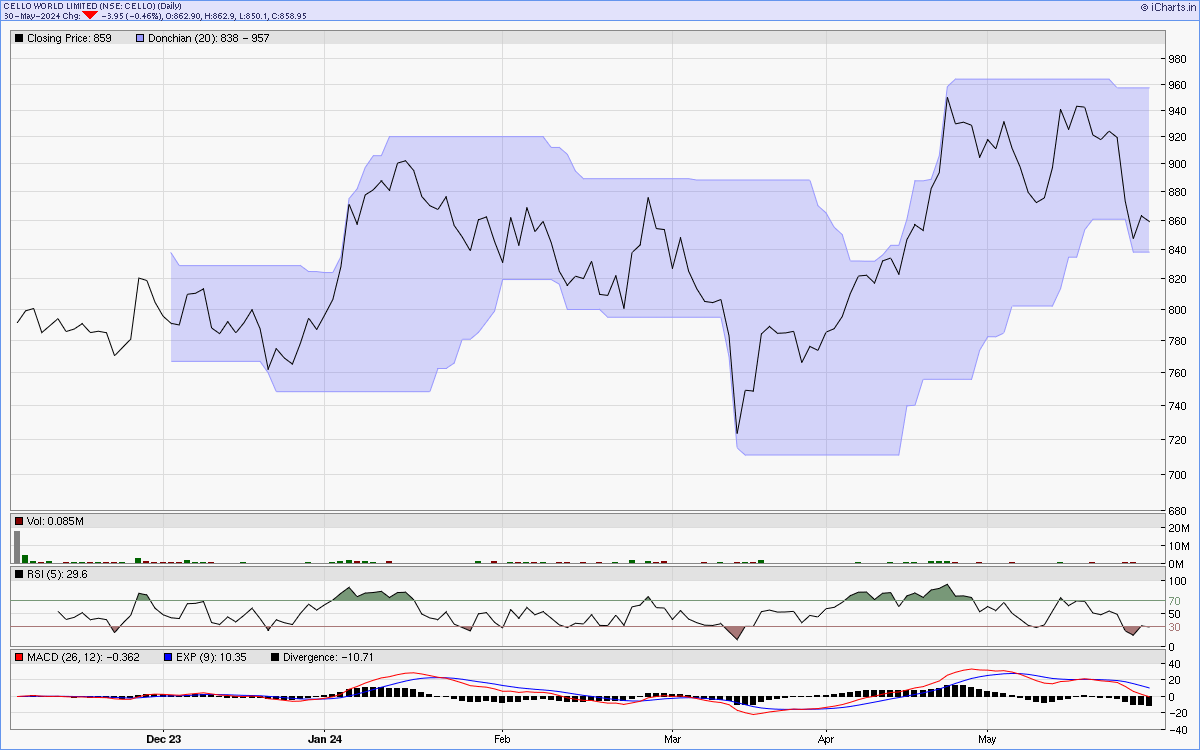
One year line chart
Two years weekly chart
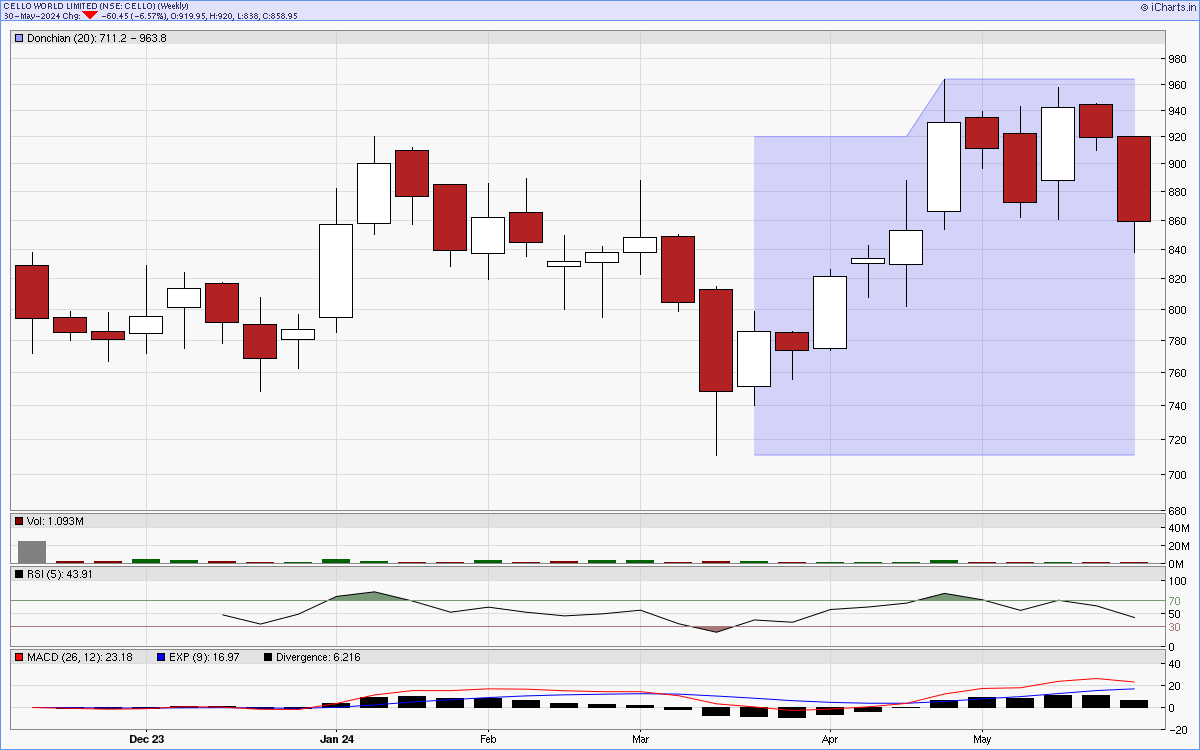
Charts courtsey: iCharts.in