Price / Percentage change:
| Open | High | Low | Close |
| Latest | 326.30 | 329.75 | 321.65 | 325.45 |
| Prev day | 321.35 | 331.45 | 320.00 | 324.05 |
| Last week | 300.00 | 317.35 | 298.10 | 313.50 |
| Last month | 272.00 | 319.35 | 268.95 | 318.40 |
| All time | | 512.80 | 125.00 | |
| 1 Day | 5 Day | 20 Day | 50 Day |
| 0.00% | 5.00% | 16.00% | 14.50% |
Trading range:
| TradingRange | Highest
Close | Lowest
Close | Highest
High | Lowest
Low |
| 5 days | 325.45 | 313.50 | 331.45 | 307.80 |
| 10 days | 325.45 | 297.05 | 331.45 | 292.55 |
| 20 days | 325.45 | 280.65 | 331.45 | 277.50 |
Trend analysis :
| Trend | First Signal | Price | Reversal | P SAR |
| BBB | 12-04-2024 | 298.95 | 277.50 | 313.46 |
| ATR (20d) | Williams R | RSI (5d) | RSI (14d) | Vol | Av Vol (20d) |
| 7.93 | 87 | 90 | 76 | 2525000 | 4883000
|
Fibonacci price projections:
| 0% | 61.8% | 100% | 161.8% | 261.8% |
| Up | 261.25 | 286.96 | 302.85 | 328.56 | 370.16 |
| Dn | 302.85 | 277.14 | 261.25 | 235.54 | 193.94 |
Intraday pivot levels:
| Sup 2 | Sup 1 | Pivot | Res 1 | Res 2 |
| 317.50 | 321.45 | 325.60 | 329.55 | 333.70 |
Weekly pivot levels:
| Sup 2 | Sup 1 | Pivot | Res 1 | Res 2 |
| 290.40 | 301.90 | 309.65 | 321.15 | 328.90 |
Monthly pivot levels:
| Sup 2 | Sup 1 | Pivot | Res 1 | Res 2 |
| 251.75 | 285.00 | 302.20 | 335.45 | 352.60 |
Moving averages (simple):
| 5 Day | 20 Day | 50 Day | 200 Day |
| 319 | 301 | 290 |
296 |
Other levels:
| 52 Week Hi - Lo | Last Mnth Hi - Lo | Swing Hi - Lo | B Band Hi - Lo |
| 331.45 - 252.10 | 319.35 - 268.95 | 302.85 - 261.25 | 328.95 - 272.82 |
|
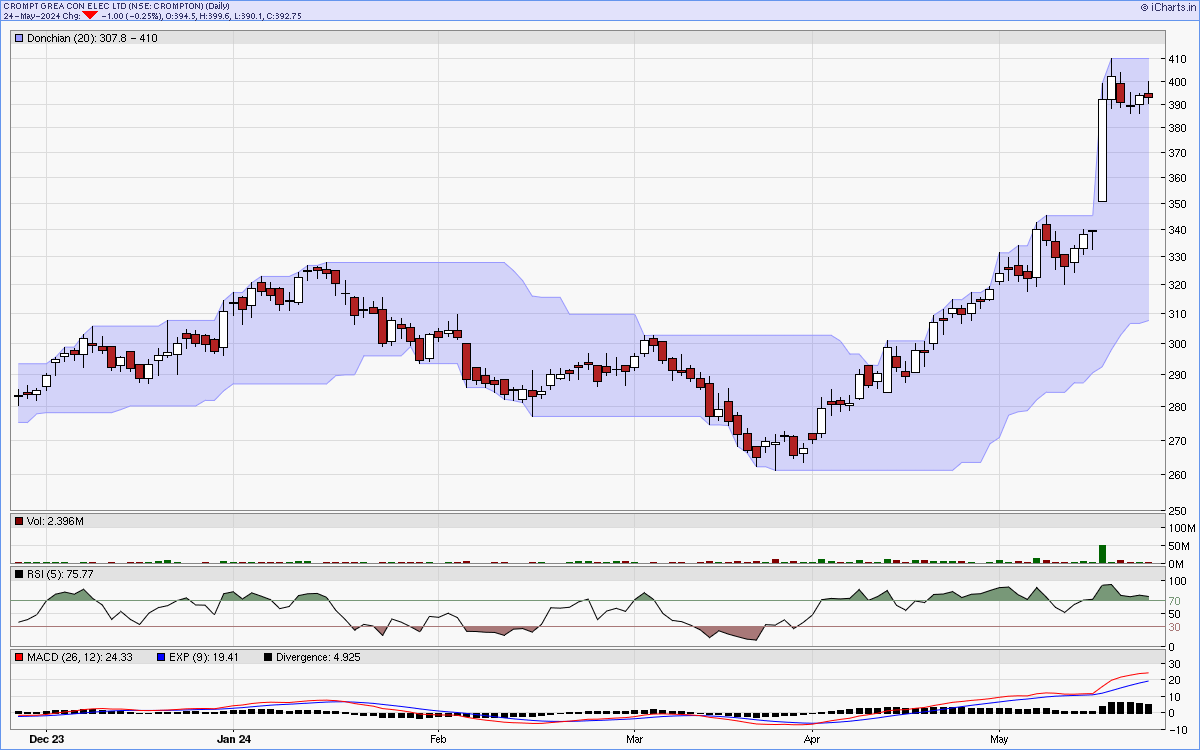
Charts...
Six months candlestick chart
Charts courtsey: iCharts.in
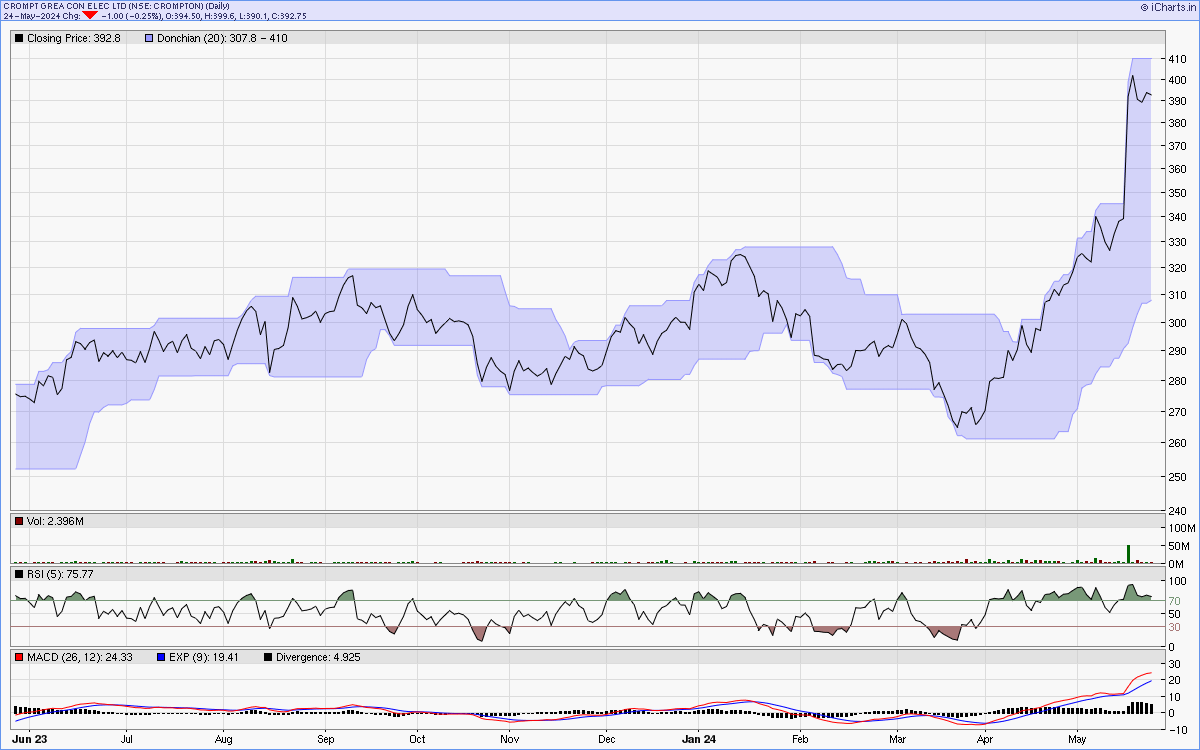
One year line chart
Two years weekly chart
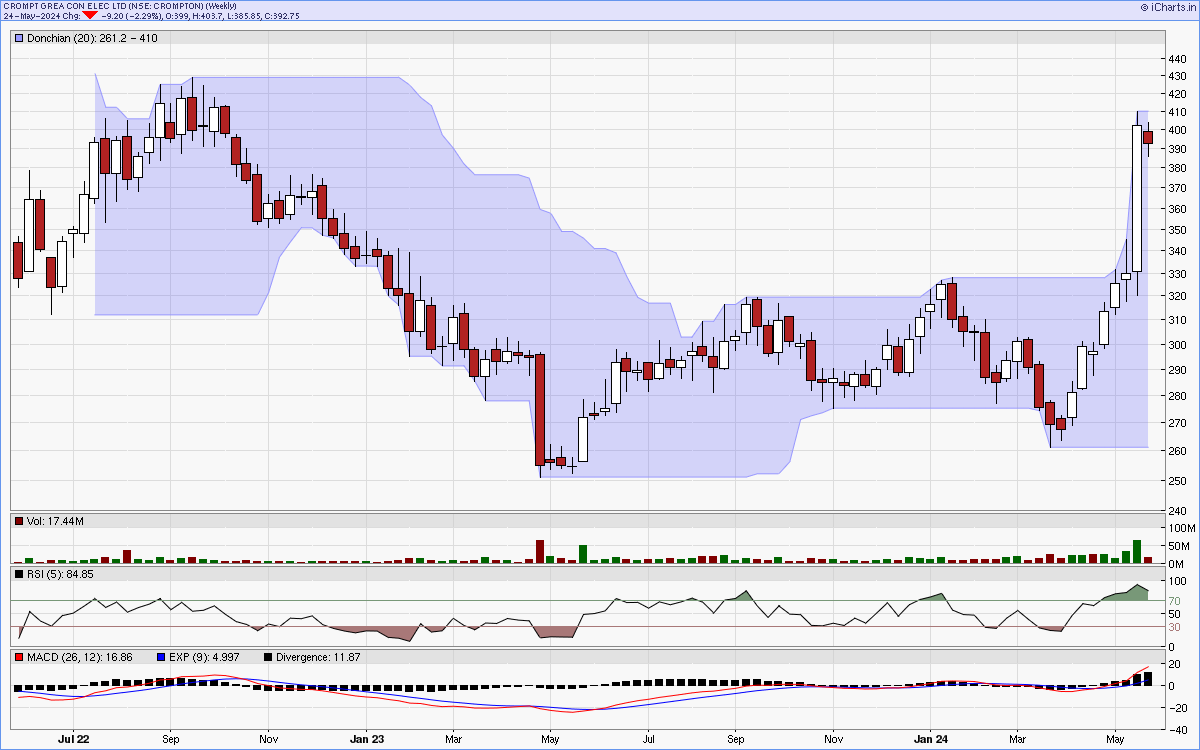
Charts courtsey: iCharts.in