Price / Percentage change:
| Open | High | Low | Close |
| Latest | 3432.15 | 3432.15 | 3361.75 | 3409.80 |
| Prev day | 3310.00 | 3478.40 | 3211.10 | 3406.85 |
| Last week | 3251.10 | 3478.40 | 3211.10 | 3406.85 |
| Last month | 3025.00 | 3336.25 | 2922.55 | 3275.45 |
| All time | | 3478.40 | 31.43 | |
| 1 Day | 5 Day | 20 Day | 50 Day |
| 0.00% | 5.00% | 11.50% | 30.00% |
Trading range:
| TradingRange | Highest
Close | Lowest
Close | Highest
High | Lowest
Low |
| 5 days | 3409.80 | 3275.45 | 3478.40 | 3211.10 |
| 10 days | 3409.80 | 3128.10 | 3478.40 | 3039.00 |
| 20 days | 3409.80 | 2938.35 | 3478.40 | 2922.55 |
Trend analysis :
| Trend | First Signal | Price | Reversal | P SAR |
| BBB | 08-11-2023 | 1767.20 | 2922.55 | 3211.10 |
| ATR (20d) | Williams R | RSI (5d) | RSI (14d) | Vol | Av Vol (20d) |
| 88.53 | 85 | 85 | 77 | 512000 | 547000
|
Fibonacci price projections:
| 0% | 61.8% | 100% | 161.8% | 261.8% |
| Up | 2652.00 | 2800.29 | 2891.95 | 3040.24 | 3280.19 |
| Dn | 2891.95 | 2743.66 | 2652.00 | 2503.71 | 2263.76 |
Intraday pivot levels:
| Sup 2 | Sup 1 | Pivot | Res 1 | Res 2 |
| 3330.80 | 3370.20 | 3401.20 | 3440.65 | 3471.60 |
Weekly pivot levels:
| Sup 2 | Sup 1 | Pivot | Res 1 | Res 2 |
| 3098.10 | 3252.45 | 3365.45 | 3519.80 | 3632.75 |
Monthly pivot levels:
| Sup 2 | Sup 1 | Pivot | Res 1 | Res 2 |
| 2764.35 | 3019.85 | 3178.05 | 3433.55 | 3591.75 |
Moving averages (simple):
| 5 Day | 20 Day | 50 Day | 200 Day |
| 3340 | 3154 | 2942 |
2160 |
Other levels:
| 52 Week Hi - Lo | Last Mnth Hi - Lo | Swing Hi - Lo | B Band Hi - Lo |
| 3478.40 - 1556.00 | 3336.25 - 2922.55 | 2891.95 - 2652.00 | 3428.65 - 2879.64 |
|
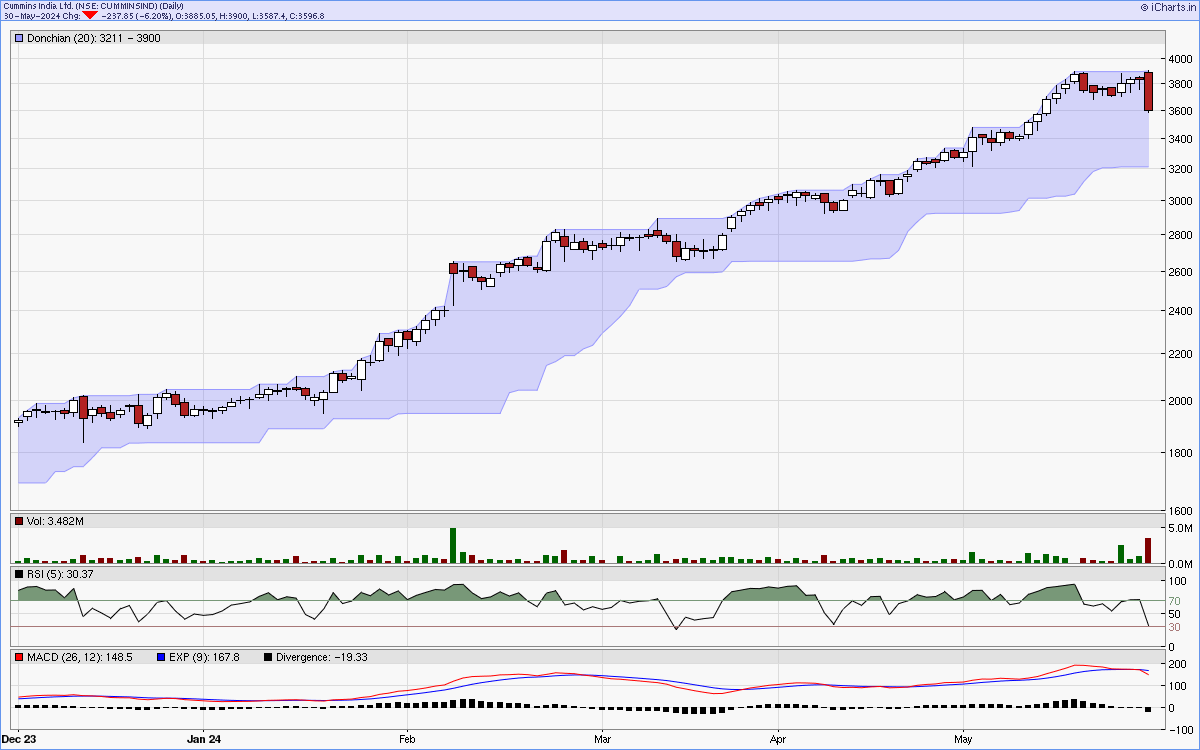
Charts...
Six months candlestick chart
Charts courtsey: iCharts.in
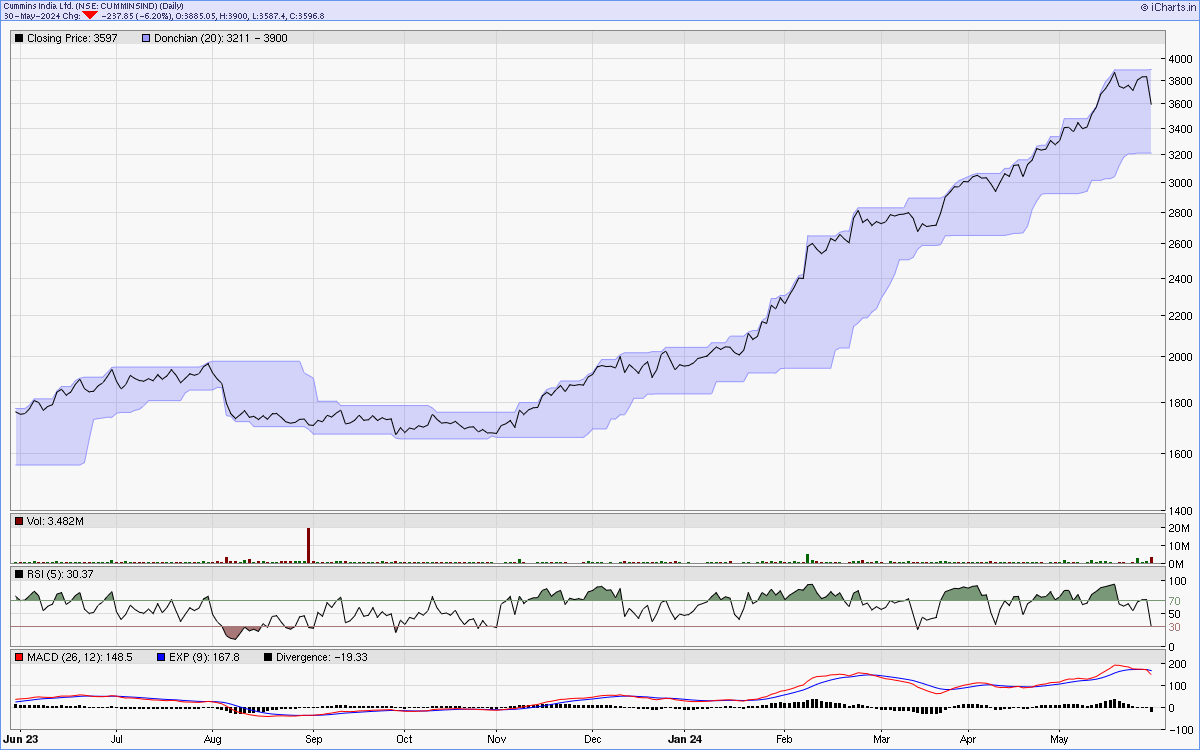
One year line chart
Two years weekly chart
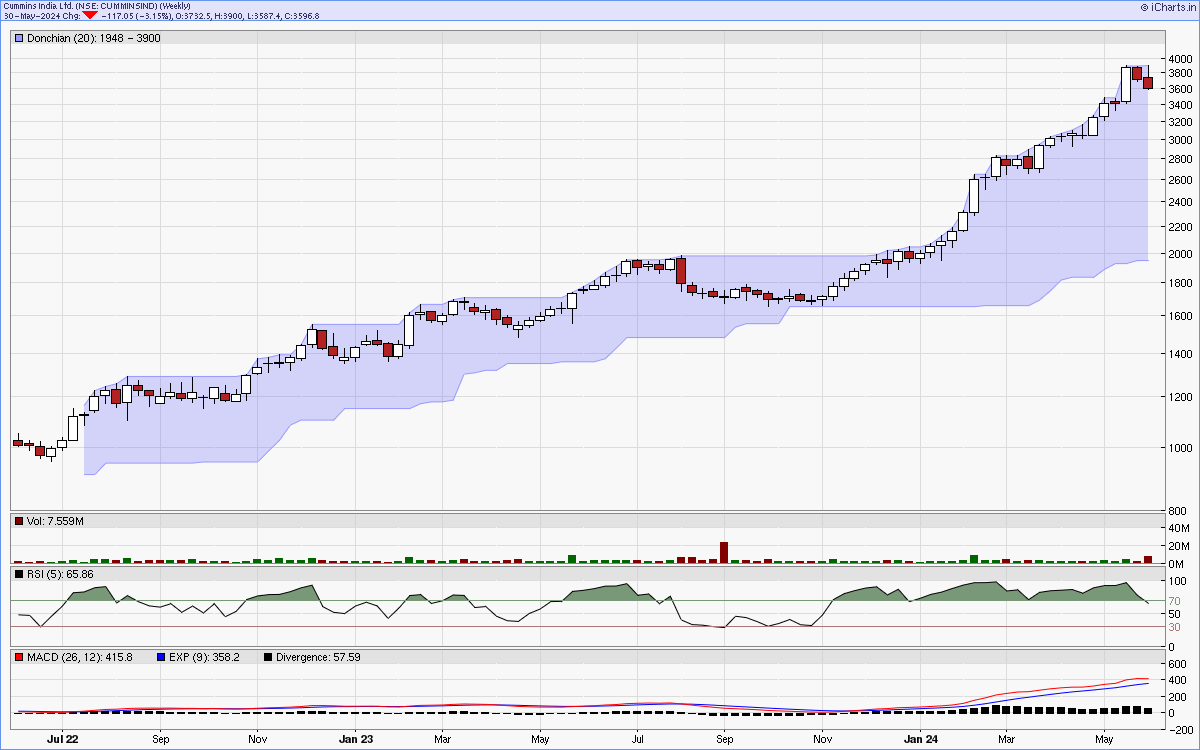
Charts courtsey: iCharts.in