Price / Percentage change:
| Open | High | Low | Close |
| Latest | 1400.00 | 1400.00 | 1360.35 | 1368.80 |
| Prev day | 1400.00 | 1407.95 | 1372.05 | 1388.90 |
| Last week | 1263.00 | 1424.65 | 1254.05 | 1396.60 |
| Last month | 1052.00 | 1428.95 | 1000.00 | 1397.10 |
| All time | | 1428.95 | 78.15 | |
| 1 Day | 5 Day | 20 Day | 50 Day |
| -1.00% | 1.00% | 30.00% | 29.00% |
Trading range:
| TradingRange | Highest
Close | Lowest
Close | Highest
High | Lowest
Low |
| 5 days | 1399.15 | 1368.80 | 1428.95 | 1340.95 |
| 10 days | 1399.15 | 1261.25 | 1428.95 | 1240.00 |
| 20 days | 1399.15 | 1087.15 | 1428.95 | 1020.05 |
Trend analysis :
| Trend | First Signal | Price | Reversal | P SAR |
| BBB | 03-04-2024 | 1088.65 | 1020.05 | 1357.99 |
| ATR (20d) | Williams R | RSI (5d) | RSI (14d) | Vol | Av Vol (20d) |
| 56.24 | 80 | 60 | 72 | 24000 | 58000
|
Fibonacci price projections:
| 0% | 61.8% | 100% | 161.8% | 261.8% |
| Up | 1195.00 | 1253.93 | 1290.35 | 1349.28 | 1444.63 |
| Dn | 1290.35 | 1231.42 | 1195.00 | 1136.07 | 1040.72 |
Intraday pivot levels:
| Sup 2 | Sup 1 | Pivot | Res 1 | Res 2 |
| 1336.65 | 1352.65 | 1376.35 | 1392.35 | 1416.00 |
Weekly pivot levels:
| Sup 2 | Sup 1 | Pivot | Res 1 | Res 2 |
| 1187.80 | 1292.15 | 1358.40 | 1462.75 | 1529.00 |
Monthly pivot levels:
| Sup 2 | Sup 1 | Pivot | Res 1 | Res 2 |
| 846.35 | 1121.70 | 1275.35 | 1550.65 | 1704.30 |
Moving averages (simple):
| 5 Day | 20 Day | 50 Day | 200 Day |
| 1390 | 1263 | 1134 |
971 |
Other levels:
| 52 Week Hi - Lo | Last Mnth Hi - Lo | Swing Hi - Lo | B Band Hi - Lo |
| 1428.95 - 637.50 | 1428.95 - 1000.00 | 1195.00 - 1290.35 | 1482.61 - 1043.00 |
|
Charts...
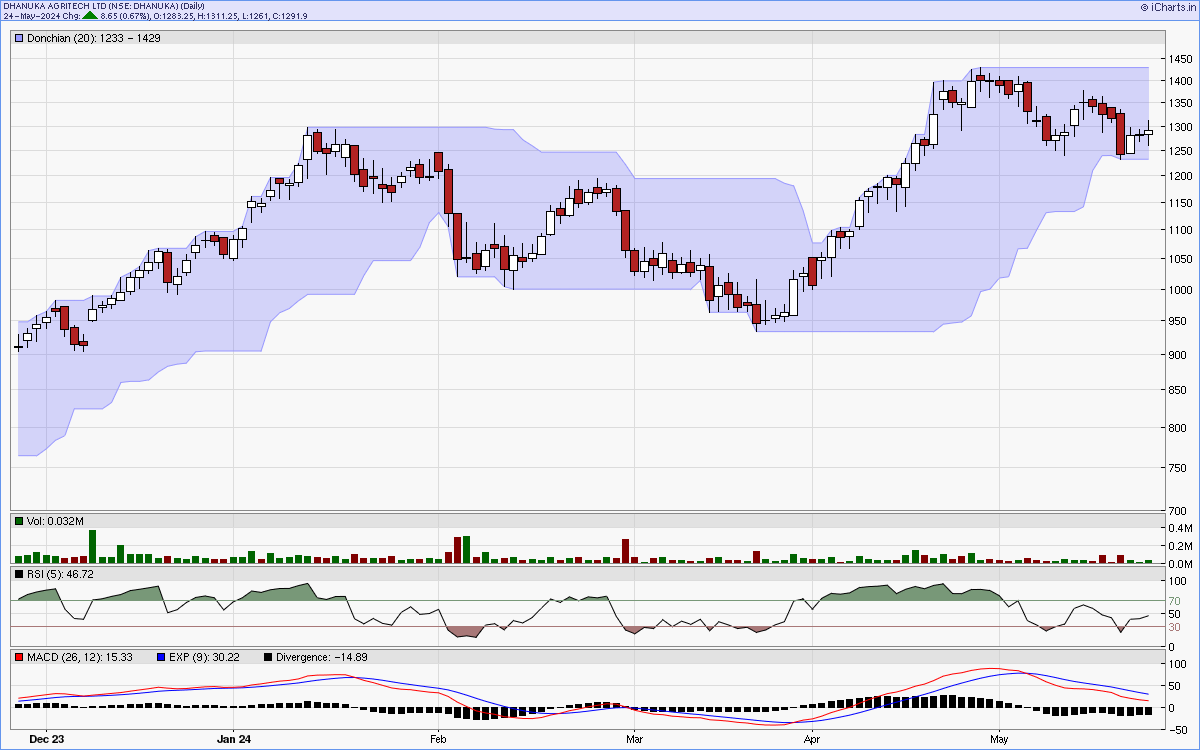
Six months candlestick chart
Charts courtsey: iCharts.in
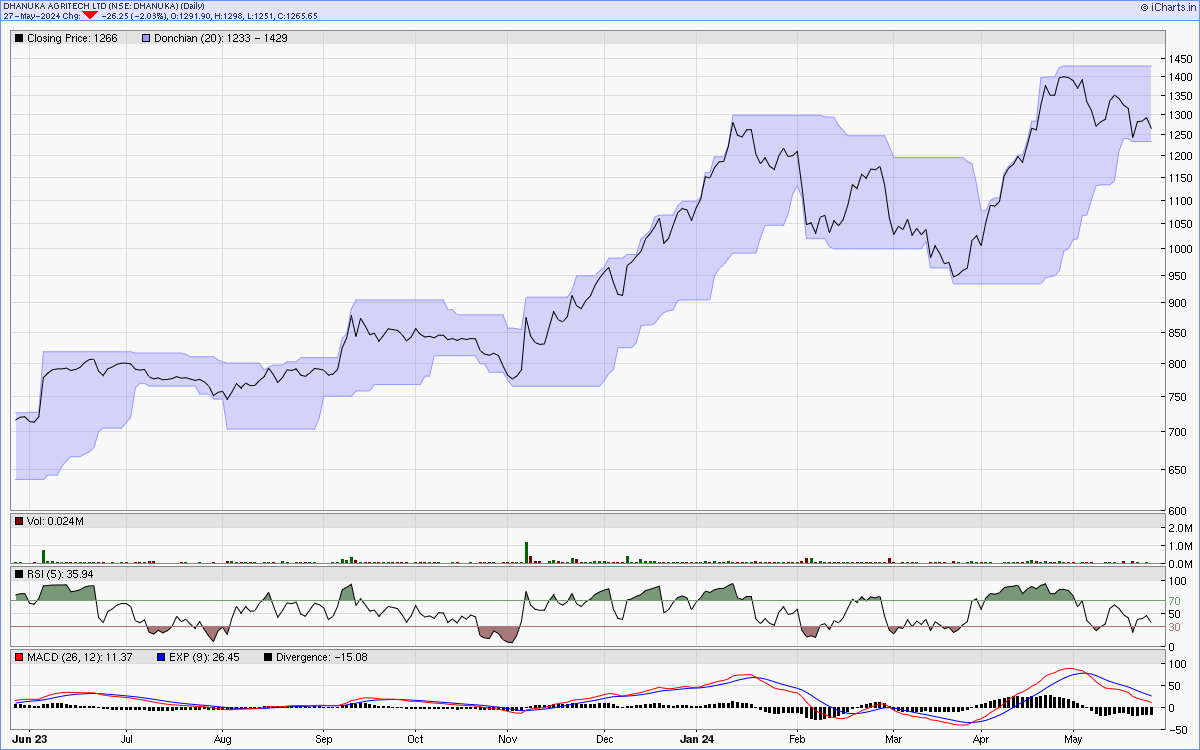
One year line chart
Two years weekly chart
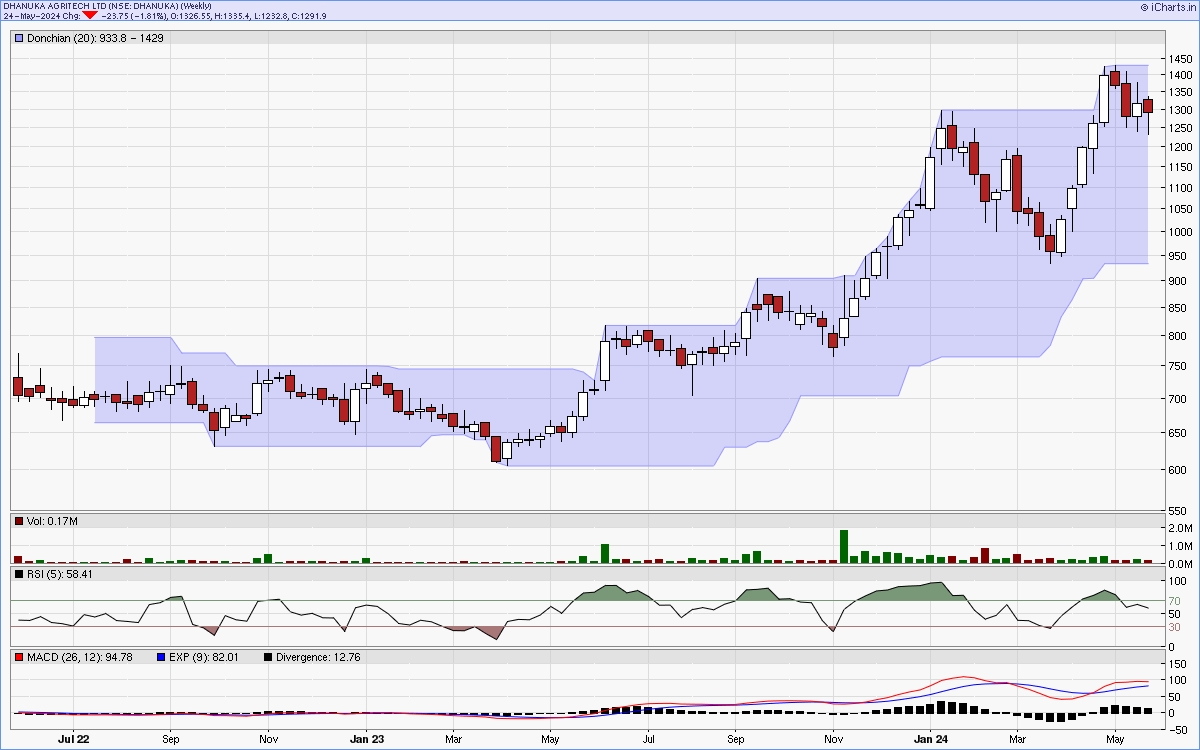
Charts courtsey: iCharts.in