Price / Percentage change:
| Open | High | Low | Close |
| Latest | 193.50 | 193.90 | 189.00 | 191.30 |
| Prev day | 191.50 | 195.75 | 191.20 | 192.35 |
| Last week | 201.05 | 208.00 | 192.00 | 193.10 |
| Last month | 183.75 | 208.00 | 163.10 | 192.00 |
| All time | | 208.00 | 8.00 | |
| 1 Day | 5 Day | 20 Day | 50 Day |
| -0.50% | -4.00% | 5.50% | 8.50% |
Trading range:
| TradingRange | Highest
Close | Lowest
Close | Highest
High | Lowest
Low |
| 5 days | 193.10 | 191.30 | 203.50 | 189.00 |
| 10 days | 204.30 | 191.30 | 208.00 | 183.05 |
| 20 days | 204.30 | 182.50 | 208.00 | 163.10 |
Trend analysis :
| Trend | First Signal | Price | Reversal | P SAR |
| BBB | 24-04-2023 | 36.50 | 163.10 | 185.50 |
| ATR (20d) | Williams R | RSI (5d) | RSI (14d) | Vol | Av Vol (20d) |
| 9.27 | 63 | 36 | 55 | 984000 | 2933000
|
Fibonacci price projections:
| 0% | 61.8% | 100% | 161.8% | 261.8% |
| Up | 163.10 | 190.85 | 208.00 | 235.75 | 280.65 |
| Dn | 208.00 | 180.25 | 163.10 | 135.35 | 90.45 |
Intraday pivot levels:
| Sup 2 | Sup 1 | Pivot | Res 1 | Res 2 |
| 186.50 | 188.90 | 191.40 | 193.80 | 196.30 |
Weekly pivot levels:
| Sup 2 | Sup 1 | Pivot | Res 1 | Res 2 |
| 181.70 | 187.35 | 197.70 | 203.35 | 213.70 |
Monthly pivot levels:
| Sup 2 | Sup 1 | Pivot | Res 1 | Res 2 |
| 142.75 | 167.35 | 187.70 | 212.30 | 232.60 |
Moving averages (simple):
| 5 Day | 20 Day | 50 Day | 200 Day |
| 192 | 193 | 177 |
116 |
Other levels:
| 52 Week Hi - Lo | Last Mnth Hi - Lo | Swing Hi - Lo | B Band Hi - Lo |
| 208.00 - 39.95 | 208.00 - 163.10 | 208.00 - 163.10 | 203.67 - 182.46 |
|
Charts...
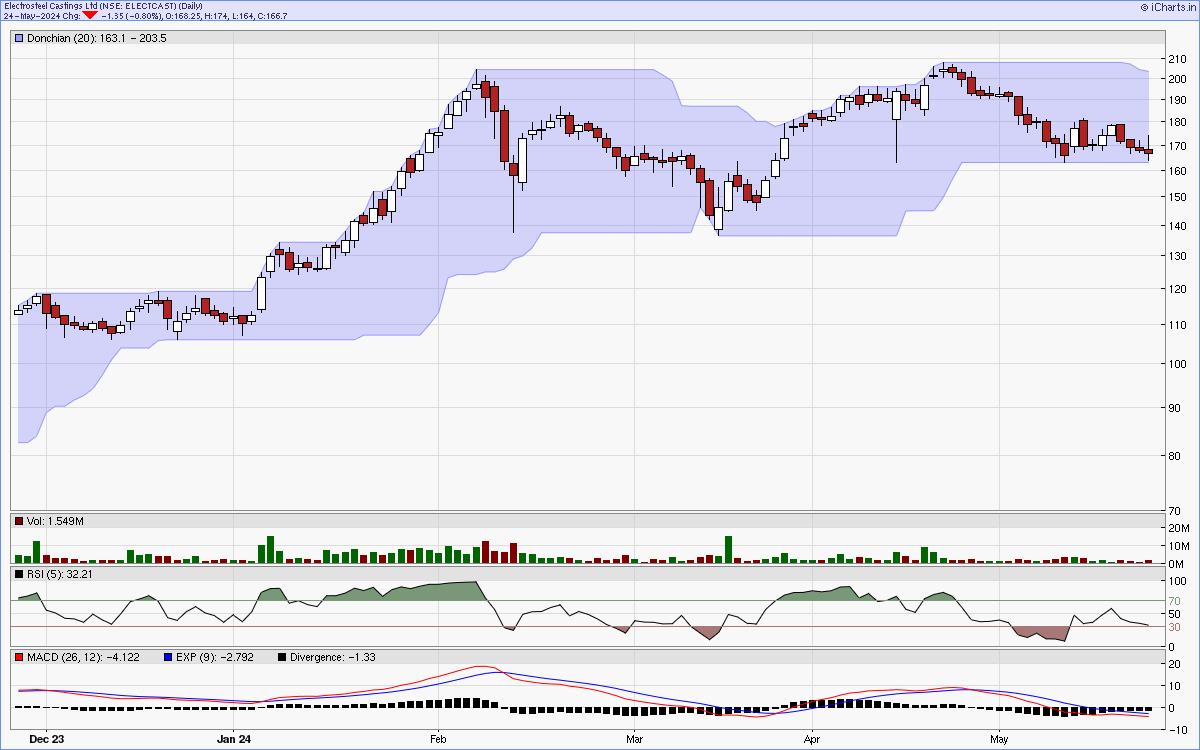
Six months candlestick chart
Charts courtsey: iCharts.in
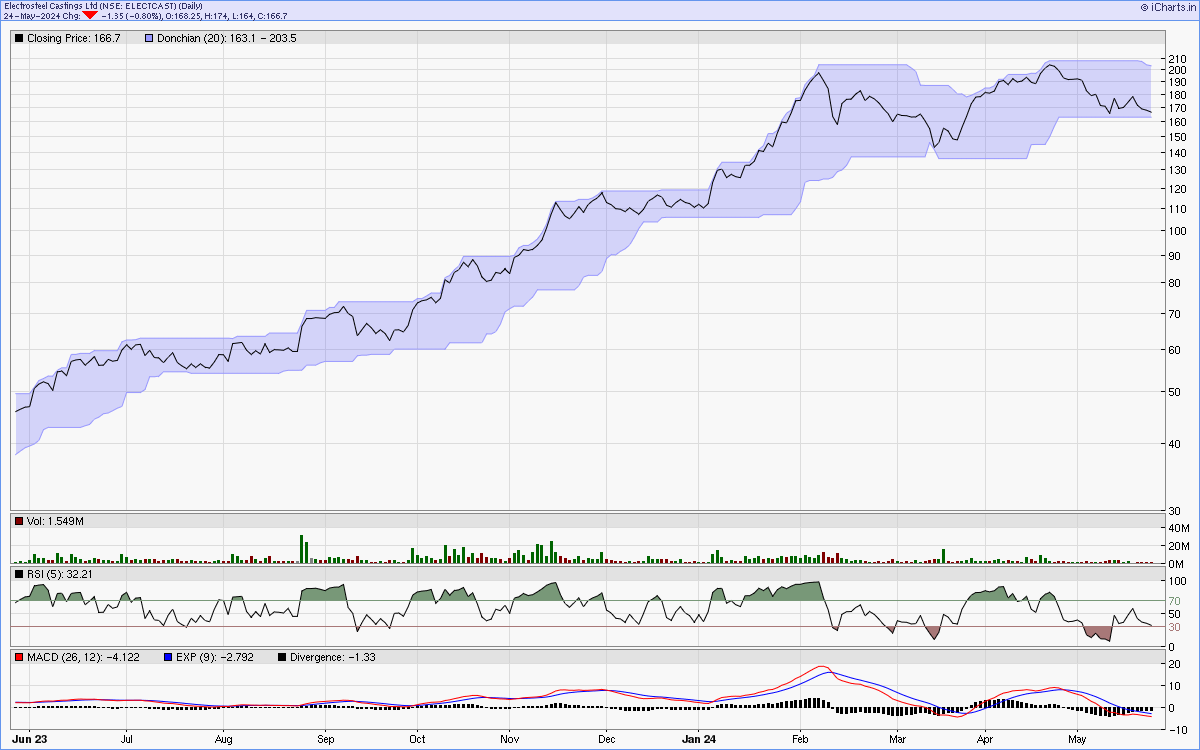
One year line chart
Two years weekly chart
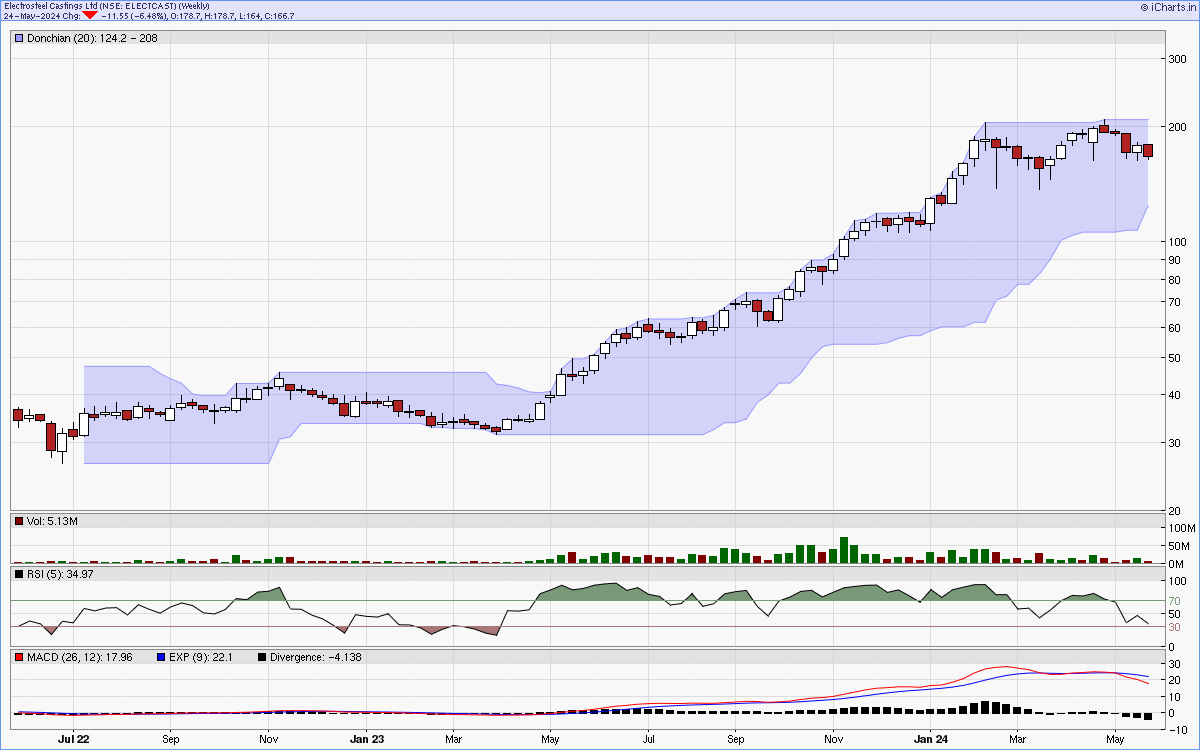
Charts courtsey: iCharts.in