Price / Percentage change:
| Open | High | Low | Close |
| Latest | 3481.00 | 3503.35 | 3397.35 | 3484.55 |
| Prev day | 3365.00 | 3491.85 | 3331.10 | 3479.80 |
| Last week | 3115.05 | 3307.30 | 3115.05 | 3291.70 |
| Last month | 2779.00 | 3410.00 | 2768.30 | 3358.55 |
| All time | | 3503.35 | 30.50 | |
| 1 Day | 5 Day | 20 Day | 50 Day |
| 0.00% | 7.00% | 21.00% | 19.50% |
Trading range:
| TradingRange | Highest
Close | Lowest
Close | Highest
High | Lowest
Low |
| 5 days | 3484.55 | 3287.35 | 3503.35 | 3200.05 |
| 10 days | 3484.55 | 3106.70 | 3503.35 | 2961.20 |
| 20 days | 3484.55 | 2998.35 | 3503.35 | 2852.00 |
Trend analysis :
| Trend | First Signal | Price | Reversal | P SAR |
| BBB | 03-04-2024 | 3006.30 | 2852.00 | 3277.70 |
| ATR (20d) | Williams R | RSI (5d) | RSI (14d) | Vol | Av Vol (20d) |
| 89.91 | 97 | 95 | 83 | 549000 | 374000
|
Fibonacci price projections:
| 0% | 61.8% | 100% | 161.8% | 261.8% |
| Up | 2922.45 | 2949.58 | 2966.35 | 2993.48 | 3037.38 |
| Dn | 2966.35 | 2939.22 | 2922.45 | 2895.32 | 2851.42 |
Intraday pivot levels:
| Sup 2 | Sup 1 | Pivot | Res 1 | Res 2 |
| 3355.75 | 3420.15 | 3461.75 | 3526.15 | 3567.75 |
Weekly pivot levels:
| Sup 2 | Sup 1 | Pivot | Res 1 | Res 2 |
| 3045.75 | 3168.70 | 3238.00 | 3360.95 | 3430.25 |
Monthly pivot levels:
| Sup 2 | Sup 1 | Pivot | Res 1 | Res 2 |
| 2537.25 | 2947.85 | 3178.95 | 3589.55 | 3820.65 |
Moving averages (simple):
| 5 Day | 20 Day | 50 Day | 200 Day |
| 3380 | 3158 | 2961 |
2970 |
Other levels:
| 52 Week Hi - Lo | Last Mnth Hi - Lo | Swing Hi - Lo | B Band Hi - Lo |
| 3503.35 - 2027.05 | 3410.00 - 2768.30 | 2966.35 - 2922.45 | 3470.44 - 2844.84 |
|
Charts...
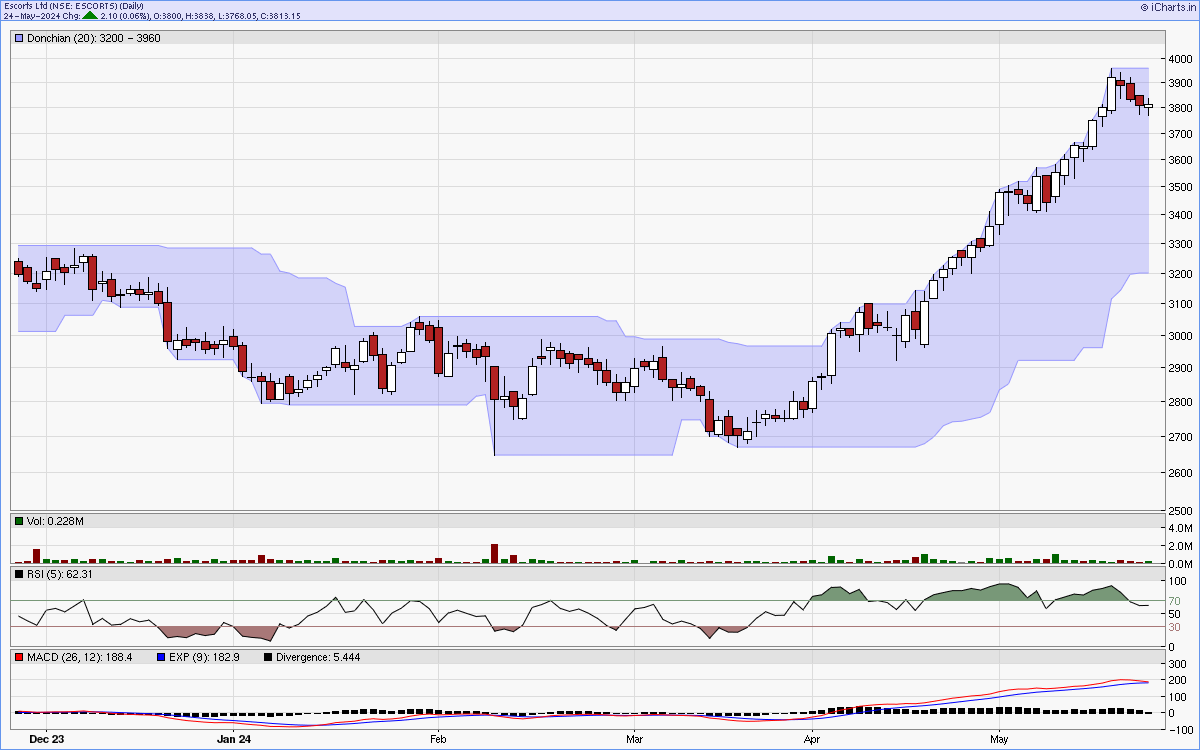
Six months candlestick chart
Charts courtsey: iCharts.in
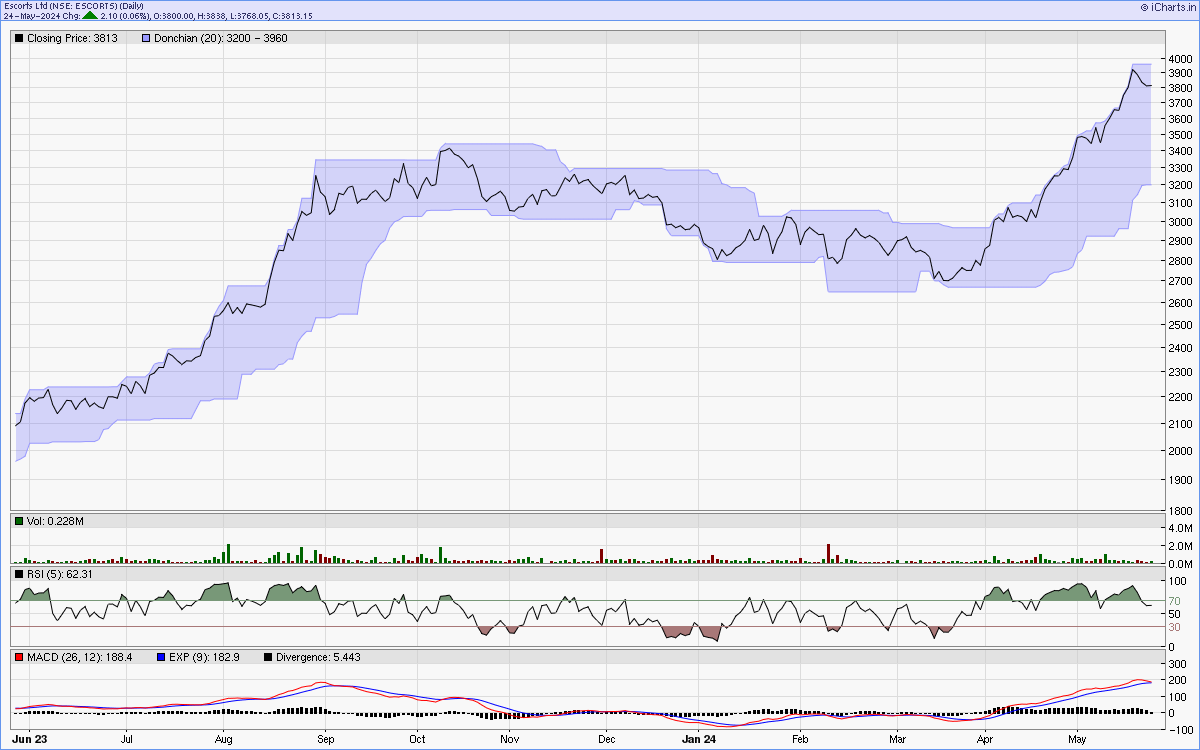
One year line chart
Two years weekly chart
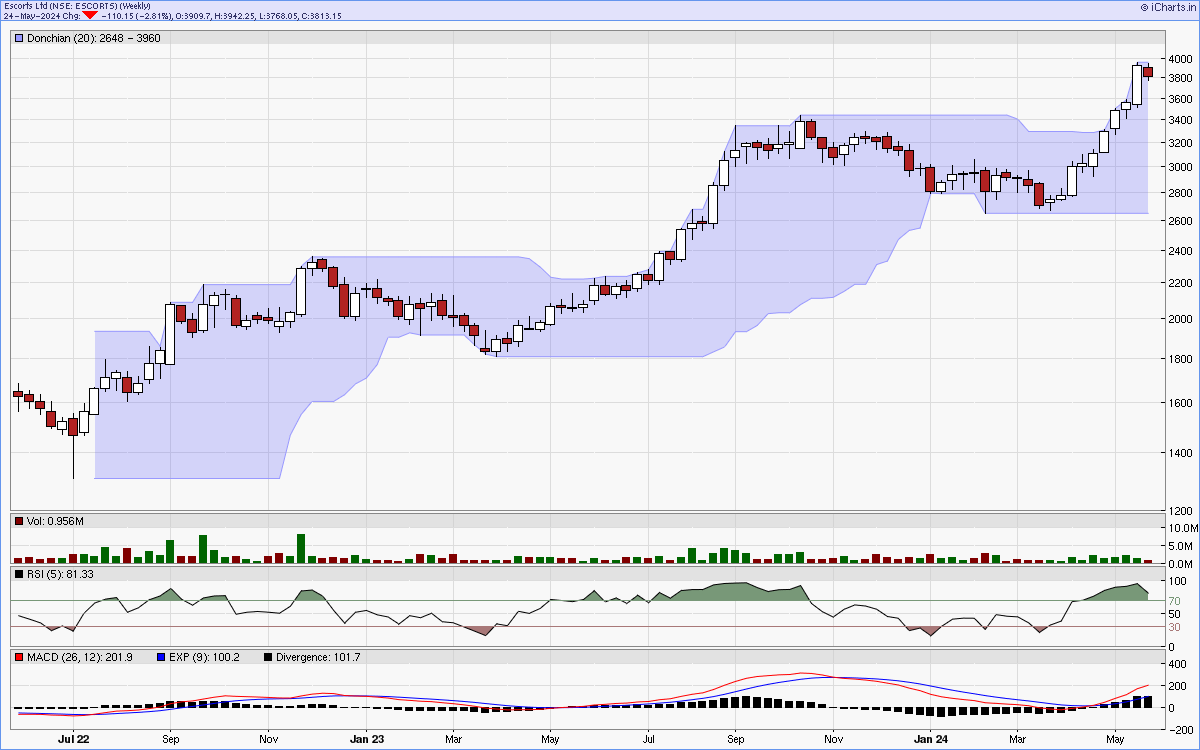
Charts courtsey: iCharts.in