Price / Percentage change:
| Open | High | Low | Close |
| Latest | 1185.00 | 1185.00 | 1100.00 | 1127.45 |
| Prev day | 1182.00 | 1198.70 | 1136.40 | 1147.15 |
| Last week | 951.85 | 1140.00 | 951.85 | 1089.70 |
| Last month | 855.00 | 1199.00 | 840.00 | 1143.20 |
| All time | | 1199.00 | 58.00 | |
| 1 Day | 5 Day | 20 Day | 50 Day |
| -1.50% | 1.00% | 27.50% | 38.50% |
Trading range:
| TradingRange | Highest
Close | Lowest
Close | Highest
High | Lowest
Low |
| 5 days | 1147.15 | 1089.70 | 1199.00 | 1070.00 |
| 10 days | 1147.15 | 951.75 | 1199.00 | 912.40 |
| 20 days | 1147.15 | 900.05 | 1199.00 | 859.80 |
Trend analysis :
| Trend | First Signal | Price | Reversal | P SAR |
| BBB | 28-11-2023 | 423.50 | 859.80 | 1016.96 |
| ATR (20d) | Williams R | RSI (5d) | RSI (14d) | Vol | Av Vol (20d) |
| 56.42 | 79 | 70 | 71 | 49000 | 142000
|
Fibonacci price projections:
| 0% | 61.8% | 100% | 161.8% | 261.8% |
| Up | 859.80 | 949.53 | 1005.00 | 1094.73 | 1239.93 |
| Dn | 1005.00 | 915.27 | 859.80 | 770.07 | 624.87 |
Intraday pivot levels:
| Sup 2 | Sup 1 | Pivot | Res 1 | Res 2 |
| 1052.45 | 1089.90 | 1137.45 | 1174.90 | 1222.45 |
Weekly pivot levels:
| Sup 2 | Sup 1 | Pivot | Res 1 | Res 2 |
| 872.35 | 981.00 | 1060.50 | 1169.15 | 1248.65 |
Monthly pivot levels:
| Sup 2 | Sup 1 | Pivot | Res 1 | Res 2 |
| 701.70 | 922.40 | 1060.70 | 1281.40 | 1419.70 |
Moving averages (simple):
| 5 Day | 20 Day | 50 Day | 200 Day |
| 1130 | 1009 | 927 |
557 |
Other levels:
| 52 Week Hi - Lo | Last Mnth Hi - Lo | Swing Hi - Lo | B Band Hi - Lo |
| 1199.00 - 176.90 | 1199.00 - 840.00 | 1005.00 - 859.80 | 1185.57 - 832.78 |
|
Charts...
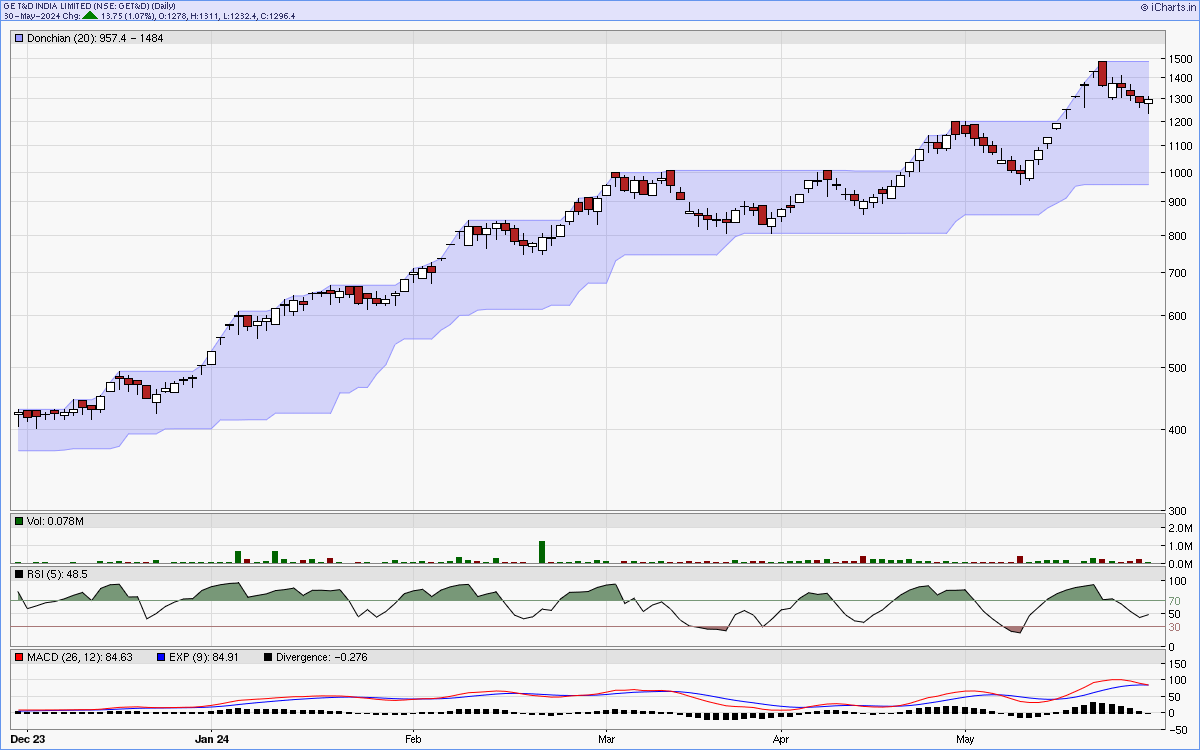
Six months candlestick chart
Charts courtsey: iCharts.in
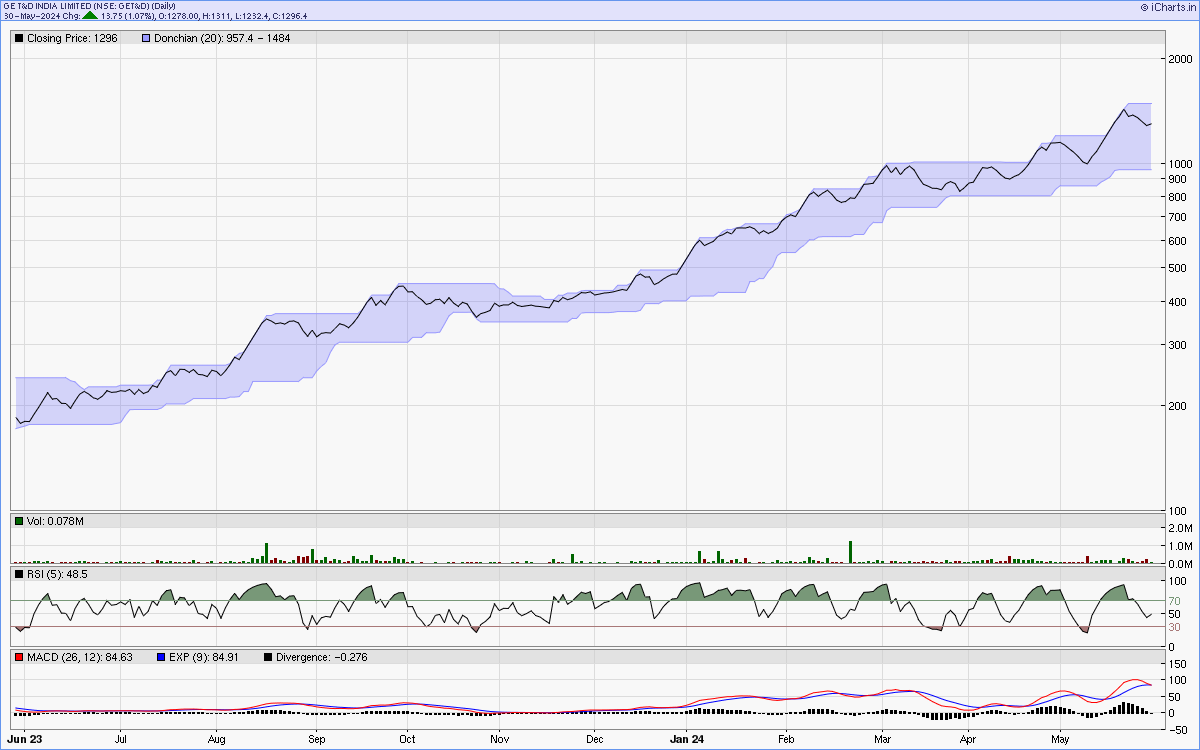
One year line chart
Two years weekly chart
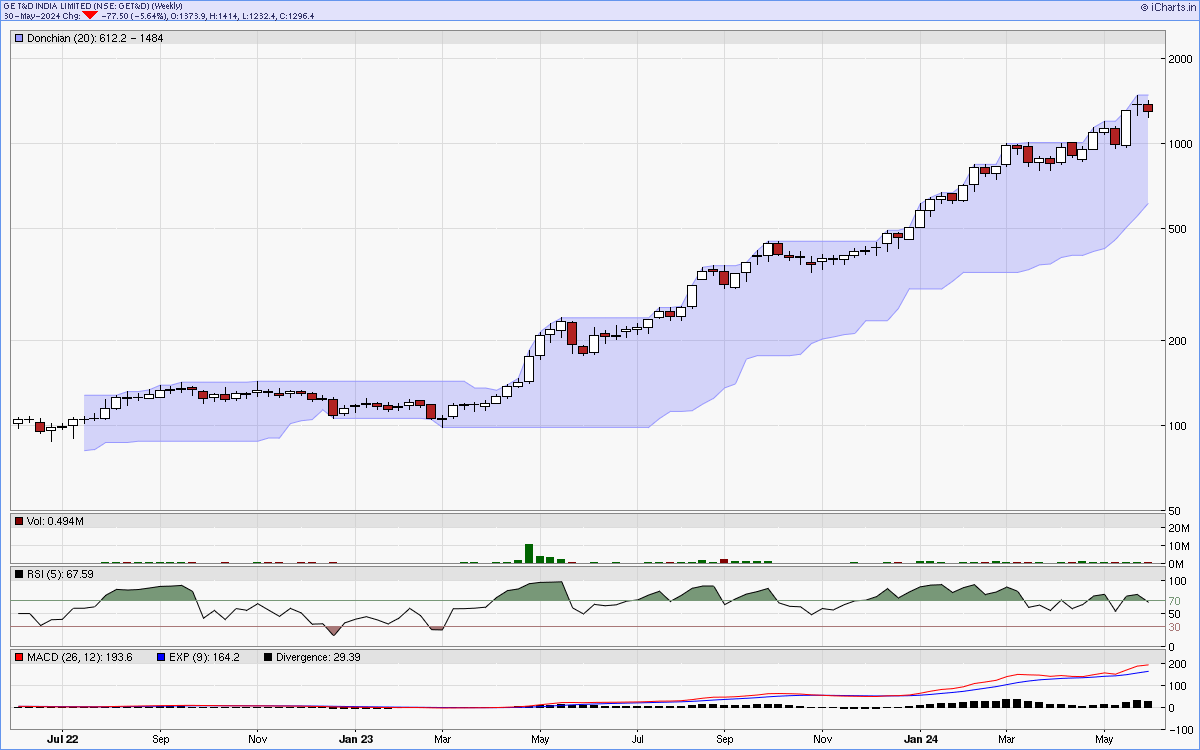
Charts courtsey: iCharts.in