Price / Percentage change:
| Open | High | Low | Close |
| Latest | 841.50 | 848.00 | 819.00 | 829.95 |
| Prev day | 837.00 | 845.45 | 821.00 | 841.15 |
| Last week | 815.90 | 866.00 | 743.85 | 814.95 |
| Last month | 790.95 | 866.00 | 743.85 | 828.90 |
| All time | | 906.00 | 370.00 | |
| 1 Day | 5 Day | 20 Day | 50 Day |
| -1.00% | 10.50% | 4.50% | -5.00% |
Trading range:
| TradingRange | Highest
Close | Lowest
Close | Highest
High | Lowest
Low |
| 5 days | 841.15 | 814.95 | 848.00 | 755.40 |
| 10 days | 841.15 | 750.50 | 866.00 | 743.85 |
| 20 days | 841.15 | 750.50 | 866.00 | 743.85 |
Trend analysis :
| Trend | First Signal | Price | Reversal | P SAR |
| BBB | 22-04-2024 | 839.55 | 743.85 | 854.26 |
| ATR (20d) | Williams R | RSI (5d) | RSI (14d) | Vol | Av Vol (20d) |
| 34.10 | 70 | 57 | 55 | 78000 | 144000
|
Fibonacci price projections:
| 0% | 61.8% | 100% | 161.8% | 261.8% |
| Up | 743.85 | 819.34 | 866.00 | 941.49 | 1063.64 |
| Dn | 866.00 | 790.51 | 743.85 | 668.36 | 546.21 |
Intraday pivot levels:
| Sup 2 | Sup 1 | Pivot | Res 1 | Res 2 |
| 803.30 | 816.55 | 832.30 | 845.60 | 861.30 |
Weekly pivot levels:
| Sup 2 | Sup 1 | Pivot | Res 1 | Res 2 |
| 686.10 | 750.50 | 808.25 | 872.65 | 930.40 |
Monthly pivot levels:
| Sup 2 | Sup 1 | Pivot | Res 1 | Res 2 |
| 690.75 | 759.80 | 812.90 | 881.95 | 935.05 |
Moving averages (simple):
| 5 Day | 20 Day | 50 Day | 200 Day |
| 827 | 813 | 804 |
702 |
Other levels:
| 52 Week Hi - Lo | Last Mnth Hi - Lo | Swing Hi - Lo | B Band Hi - Lo |
| 906.00 - 513.10 | 866.00 - 743.85 | 866.00 - 743.85 | 851.46 - 773.56 |
|
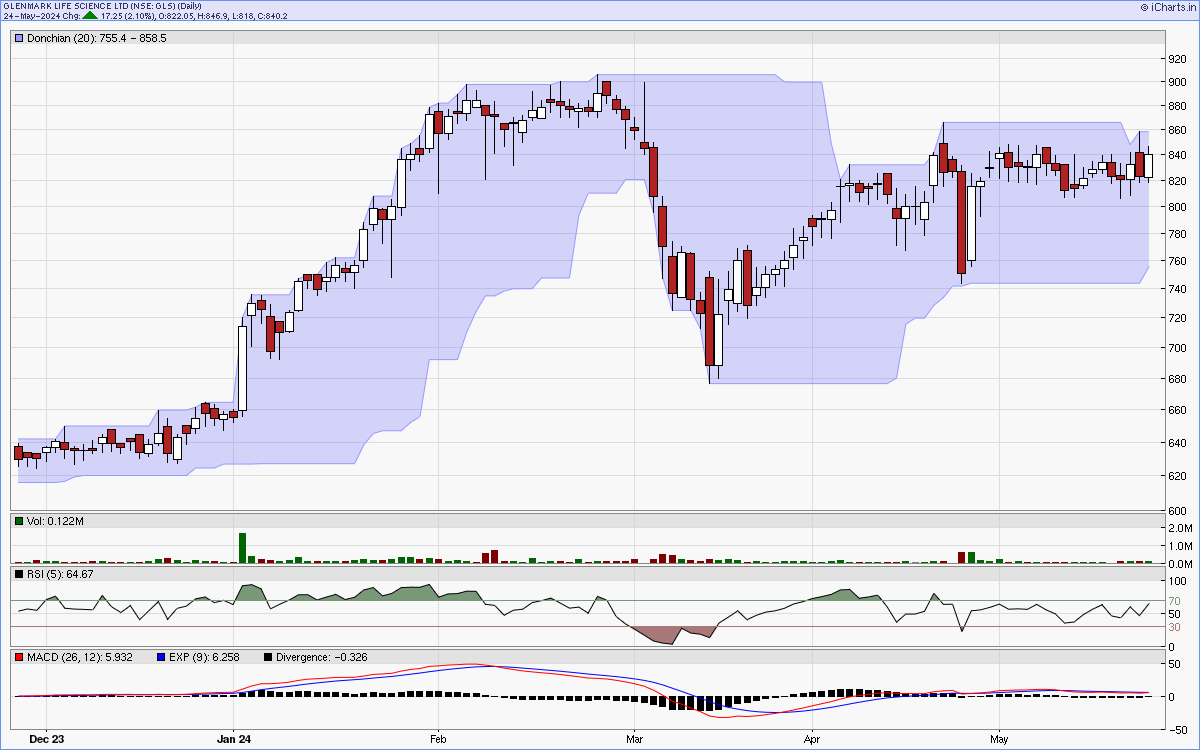
Charts...
Six months candlestick chart
Charts courtsey: iCharts.in
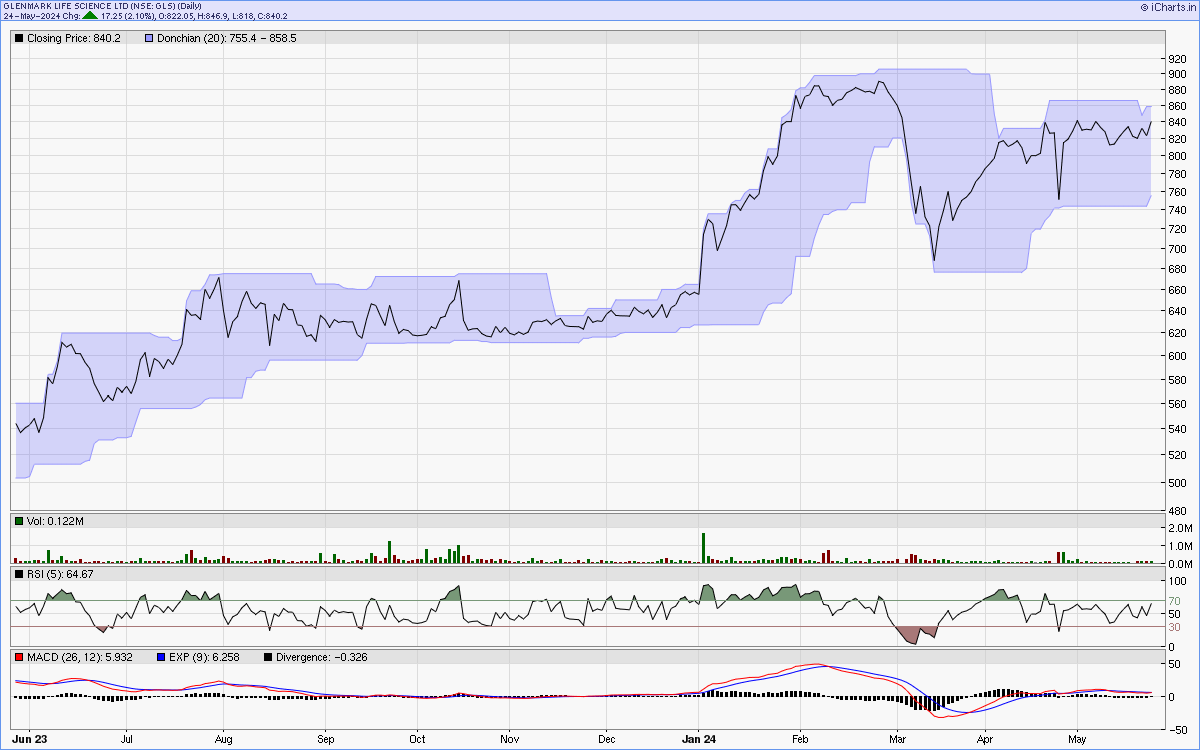
One year line chart
Two years weekly chart
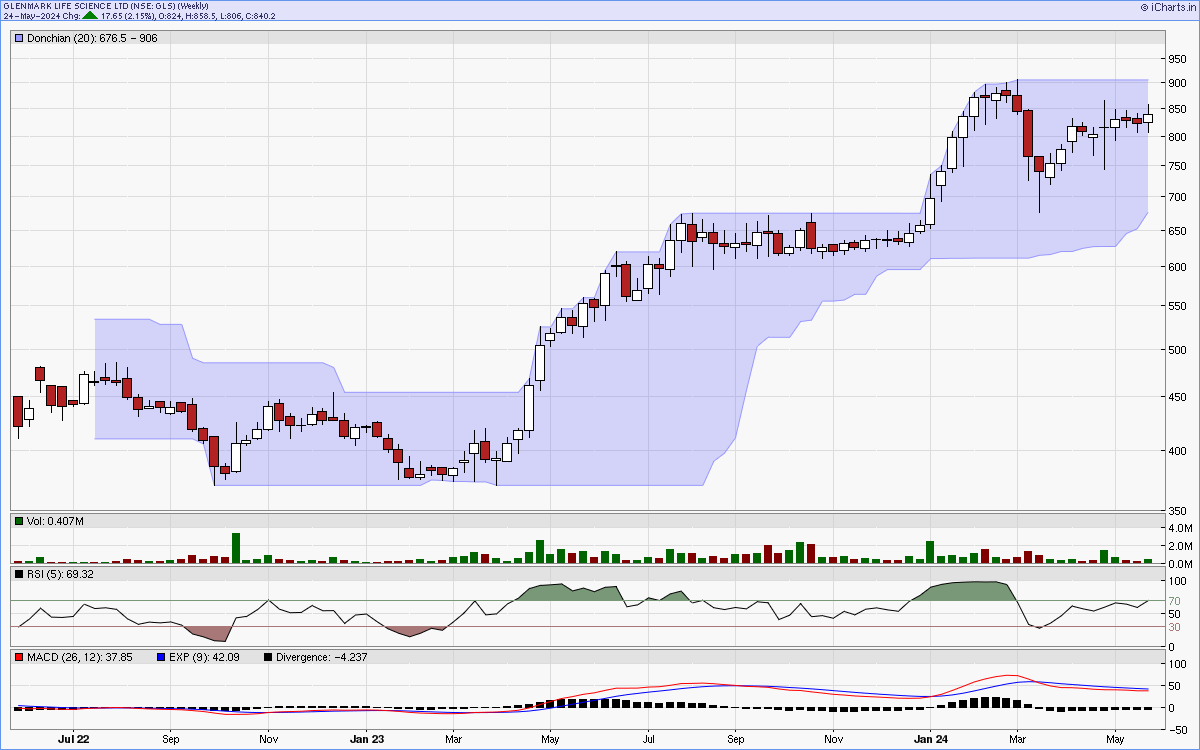
Charts courtsey: iCharts.in