Price / Percentage change:
| Open | High | Low | Close |
| Latest | 892.45 | 921.40 | 888.00 | 905.20 |
| Prev day | 878.15 | 906.35 | 875.00 | 889.95 |
| Last week | 878.80 | 915.00 | 860.00 | 889.10 |
| Last month | 756.70 | 915.00 | 730.05 | 889.95 |
| All time | | 921.40 | 9.74 | |
| 1 Day | 5 Day | 20 Day | 50 Day |
| 1.50% | 0.50% | 21.00% | 19.50% |
Trading range:
| TradingRange | Highest
Close | Lowest
Close | Highest
High | Lowest
Low |
| 5 days | 907.80 | 873.05 | 921.40 | 865.15 |
| 10 days | 907.80 | 843.15 | 921.40 | 829.00 |
| 20 days | 907.80 | 744.55 | 921.40 | 730.05 |
Trend analysis :
| Trend | First Signal | Price | Reversal | P SAR |
| BBB | 10-04-2024 | 807.30 | 730.05 | 875.00 |
| ATR (20d) | Williams R | RSI (5d) | RSI (14d) | Vol | Av Vol (20d) |
| 34.12 | 89 | 70 | 70 | 402000 | 670000
|
Fibonacci price projections:
| 0% | 61.8% | 100% | 161.8% | 261.8% |
| Up | 777.65 | 780.96 | 783.00 | 786.31 | 791.66 |
| Dn | 783.00 | 779.69 | 777.65 | 774.34 | 768.99 |
Intraday pivot levels:
| Sup 2 | Sup 1 | Pivot | Res 1 | Res 2 |
| 871.45 | 888.30 | 904.85 | 921.70 | 938.25 |
Weekly pivot levels:
| Sup 2 | Sup 1 | Pivot | Res 1 | Res 2 |
| 833.00 | 861.00 | 888.00 | 916.00 | 943.00 |
Monthly pivot levels:
| Sup 2 | Sup 1 | Pivot | Res 1 | Res 2 |
| 660.05 | 775.00 | 845.00 | 959.95 | 1029.95 |
Moving averages (simple):
| 5 Day | 20 Day | 50 Day | 200 Day |
| 893 | 831 | 773 |
680 |
Other levels:
| 52 Week Hi - Lo | Last Mnth Hi - Lo | Swing Hi - Lo | B Band Hi - Lo |
| 921.40 - 355.10 | 915.00 - 730.05 | 777.65 - 783.00 | 949.02 - 713.53 |
|
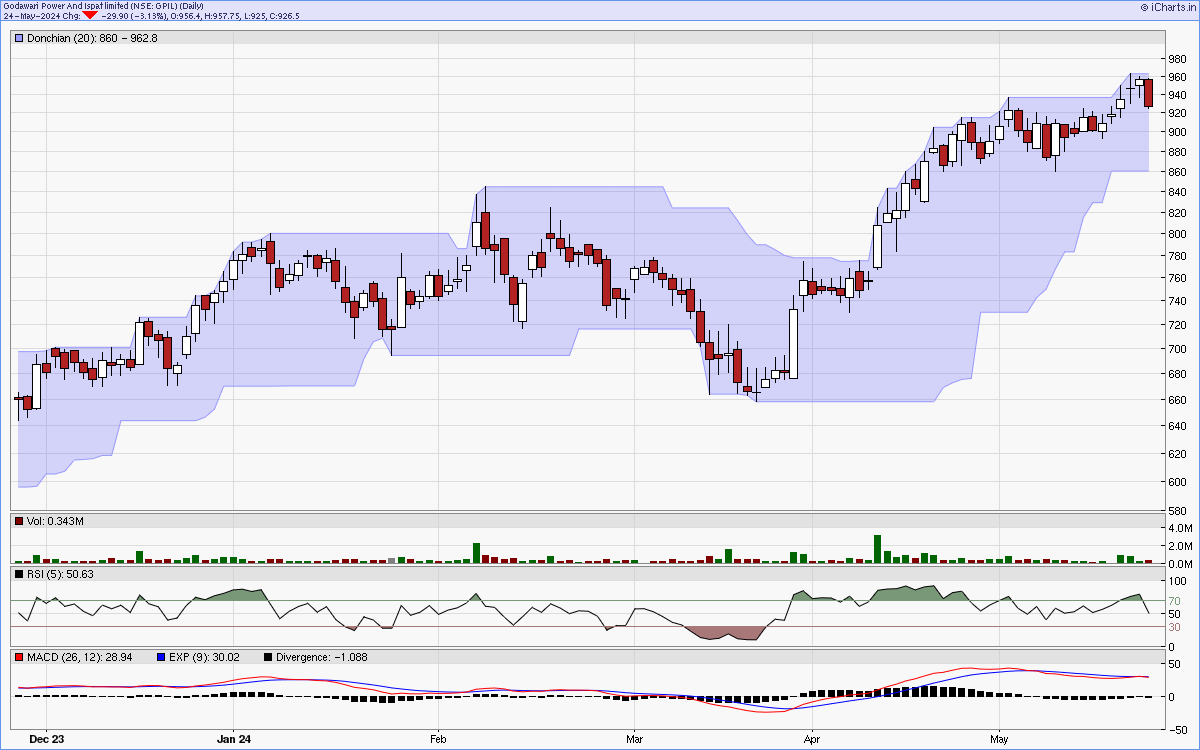
Charts...
Six months candlestick chart
Charts courtsey: iCharts.in
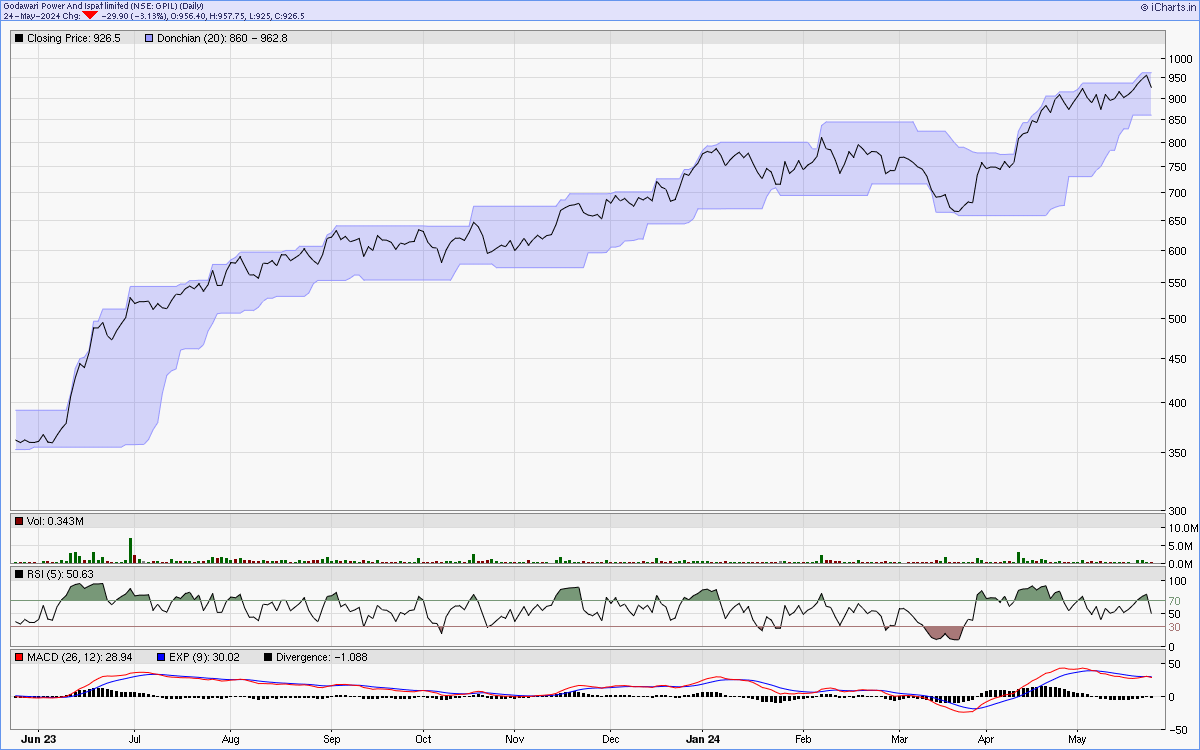
One year line chart
Two years weekly chart
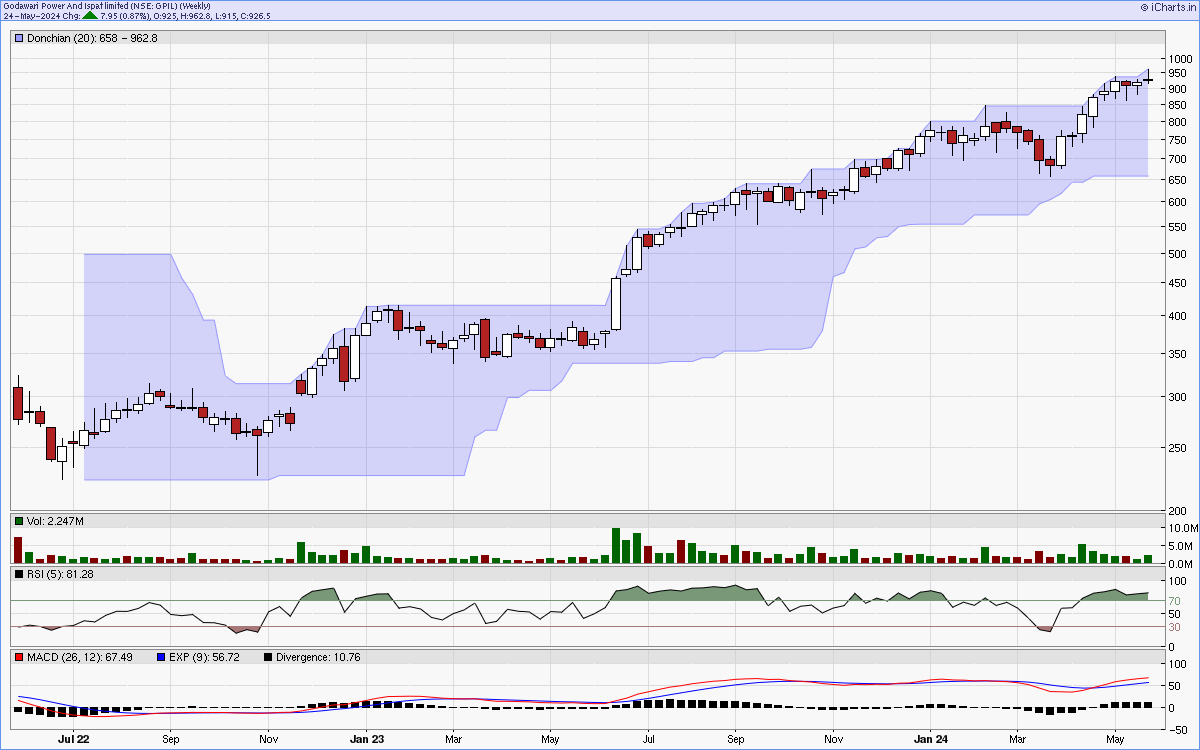
Charts courtsey: iCharts.in