Price / Percentage change:
| Open | High | Low | Close |
| Latest | 297.45 | 300.75 | 295.55 | 296.95 |
| Prev day | 296.50 | 297.75 | 293.45 | 294.15 |
| Last week | 315.00 | 327.65 | 292.00 | 293.05 |
| Last month | 356.55 | 399.50 | 292.00 | 296.00 |
| All time | | 406.75 | 25.95 | |
| 1 Day | 5 Day | 20 Day | 50 Day |
| 0.50% | 1.00% | -18.50% | -20.50% |
Trading range:
| TradingRange | Highest
Close | Lowest
Close | Highest
High | Lowest
Low |
| 5 days | 298.50 | 293.05 | 302.05 | 292.00 |
| 10 days | 377.65 | 293.05 | 385.10 | 292.00 |
| 20 days | 391.95 | 293.05 | 399.50 | 292.00 |
Trend analysis :
| Trend | First Signal | Price | Reversal | P SAR |
| SSS | 22-04-2024 | 303.85 | 399.50 | 349.75 |
| ATR (20d) | Williams R | RSI (5d) | RSI (14d) | Vol | Av Vol (20d) |
| 14.81 | 5 | 27 | 31 | 3168000 | 5089000
|
Fibonacci price projections:
| 0% | 61.8% | 100% | 161.8% | 261.8% |
| Up | 361.05 | 384.81 | 399.50 | 423.26 | 461.71 |
| Dn | 399.50 | 375.74 | 361.05 | 337.29 | 298.84 |
Intraday pivot levels:
| Sup 2 | Sup 1 | Pivot | Res 1 | Res 2 |
| 292.55 | 294.75 | 297.75 | 299.95 | 302.95 |
Weekly pivot levels:
| Sup 2 | Sup 1 | Pivot | Res 1 | Res 2 |
| 268.55 | 280.75 | 304.20 | 316.40 | 339.80 |
Monthly pivot levels:
| Sup 2 | Sup 1 | Pivot | Res 1 | Res 2 |
| 221.65 | 258.75 | 329.15 | 366.25 | 436.65 |
Moving averages (simple):
| 5 Day | 20 Day | 50 Day | 200 Day |
| 296 | 342 | 352 |
311 |
Other levels:
| 52 Week Hi - Lo | Last Mnth Hi - Lo | Swing Hi - Lo | B Band Hi - Lo |
| 406.75 - 254.50 | 399.50 - 292.00 | 399.50 - 361.05 | 424.68 - 259.52 |
|
Charts...
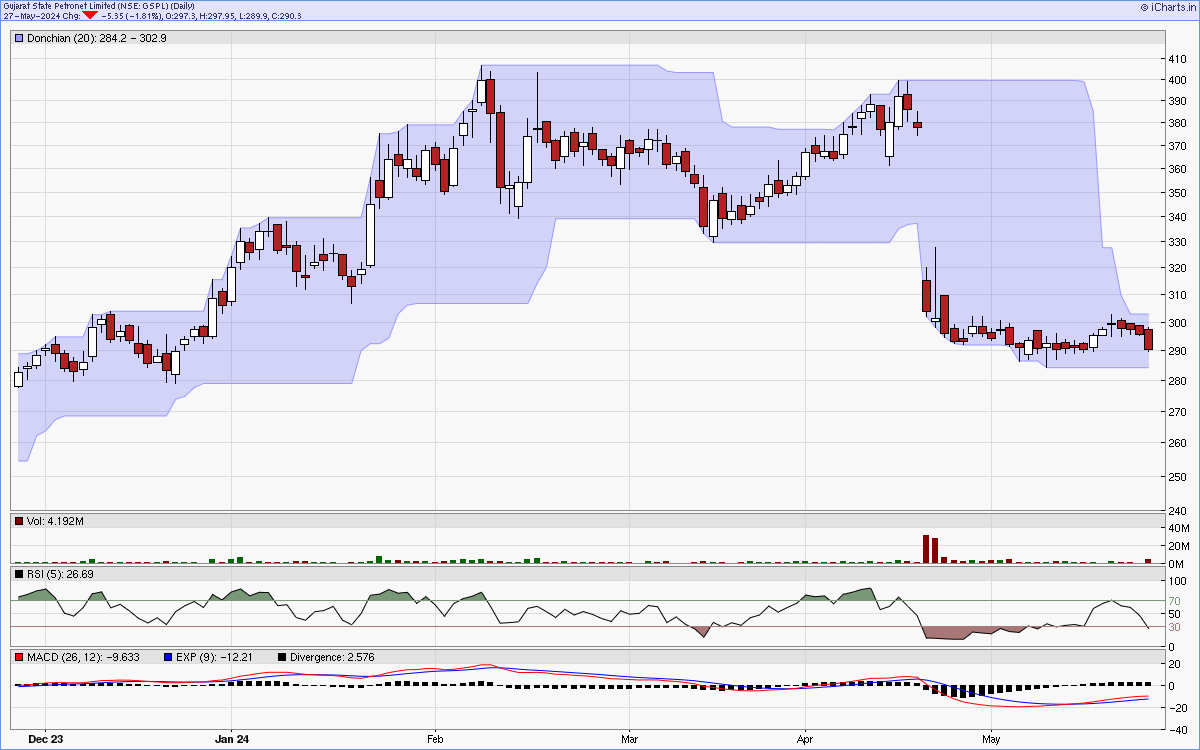
Six months candlestick chart
Charts courtsey: iCharts.in
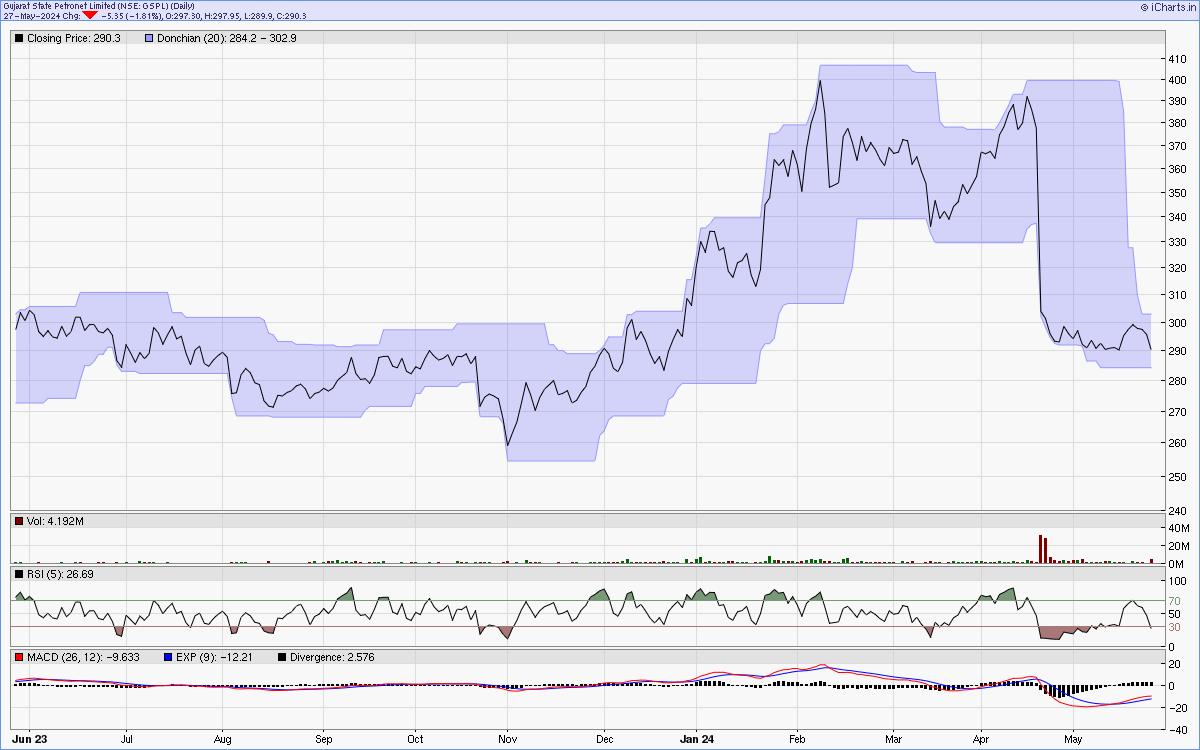
One year line chart
Two years weekly chart
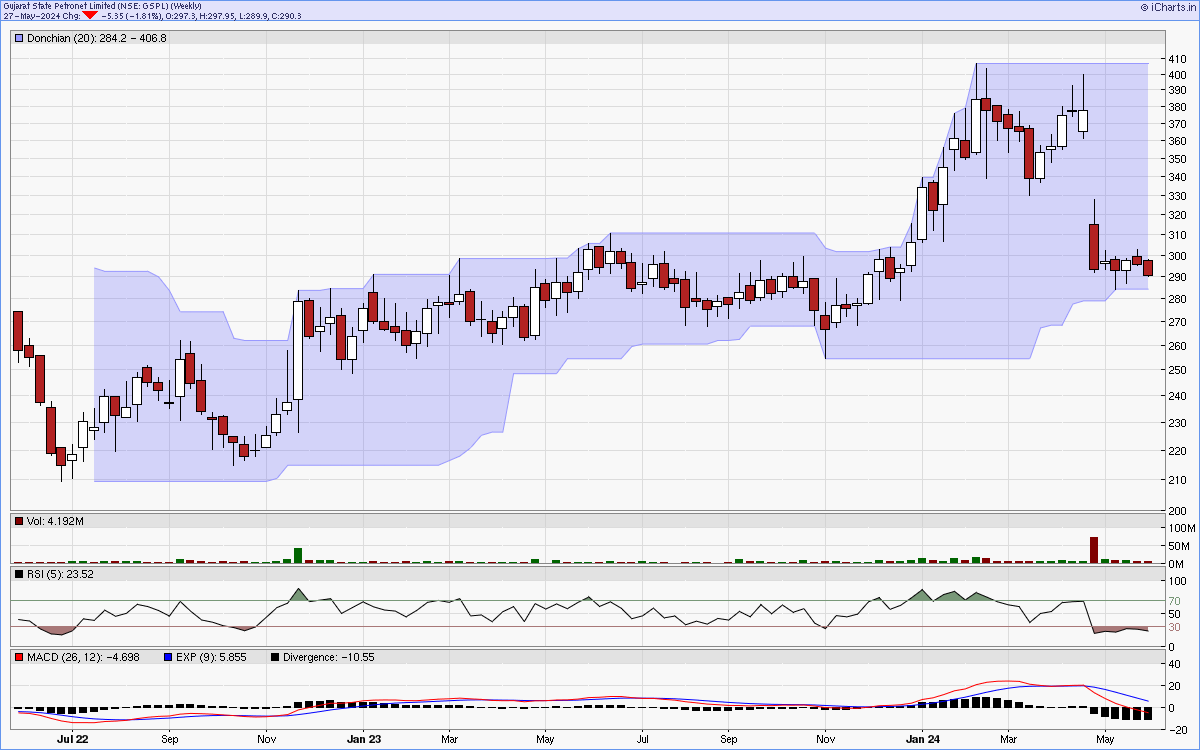
Charts courtsey: iCharts.in