Price / Percentage change:
| Open | High | Low | Close |
| Latest | 1199.95 | 1200.80 | 1151.10 | 1163.30 |
| Prev day | 1205.85 | 1211.00 | 1170.20 | 1193.95 |
| Last week | 1185.50 | 1227.95 | 1170.20 | 1193.95 |
| Last month | 926.50 | 1229.00 | 920.00 | 1189.15 |
| All time | | 1229.00 | 126.35 | |
| 1 Day | 5 Day | 20 Day | 50 Day |
| -2.50% | -0.50% | 7.00% | 25.50% |
Trading range:
| TradingRange | Highest
Close | Lowest
Close | Highest
High | Lowest
Low |
| 5 days | 1205.80 | 1163.30 | 1227.95 | 1151.10 |
| 10 days | 1205.80 | 1043.85 | 1229.00 | 1026.00 |
| 20 days | 1205.80 | 1025.05 | 1229.00 | 1001.25 |
Trend analysis :
| Trend | First Signal | Price | Reversal | P SAR |
| BBB | 11-01-2024 | 885.25 | 1001.25 | 1046.28 |
| ATR (20d) | Williams R | RSI (5d) | RSI (14d) | Vol | Av Vol (20d) |
| 46.05 | 71 | 54 | 65 | 108000 | 264000
|
Fibonacci price projections:
| 0% | 61.8% | 100% | 161.8% | 261.8% |
| Up | 1001.25 | 1077.08 | 1123.95 | 1199.78 | 1322.48 |
| Dn | 1123.95 | 1048.12 | 1001.25 | 925.42 | 802.72 |
Intraday pivot levels:
| Sup 2 | Sup 1 | Pivot | Res 1 | Res 2 |
| 1122.00 | 1142.60 | 1171.70 | 1192.30 | 1221.40 |
Weekly pivot levels:
| Sup 2 | Sup 1 | Pivot | Res 1 | Res 2 |
| 1139.60 | 1166.70 | 1197.35 | 1224.45 | 1255.10 |
Monthly pivot levels:
| Sup 2 | Sup 1 | Pivot | Res 1 | Res 2 |
| 803.70 | 996.40 | 1112.70 | 1305.40 | 1421.70 |
Moving averages (simple):
| 5 Day | 20 Day | 50 Day | 200 Day |
| 1191 | 1102 | 993 |
930 |
Other levels:
| 52 Week Hi - Lo | Last Mnth Hi - Lo | Swing Hi - Lo | B Band Hi - Lo |
| 1229.00 - 805.10 | 1229.00 - 920.00 | 1123.95 - 1001.25 | 1225.49 - 978.96 |
|
Charts...
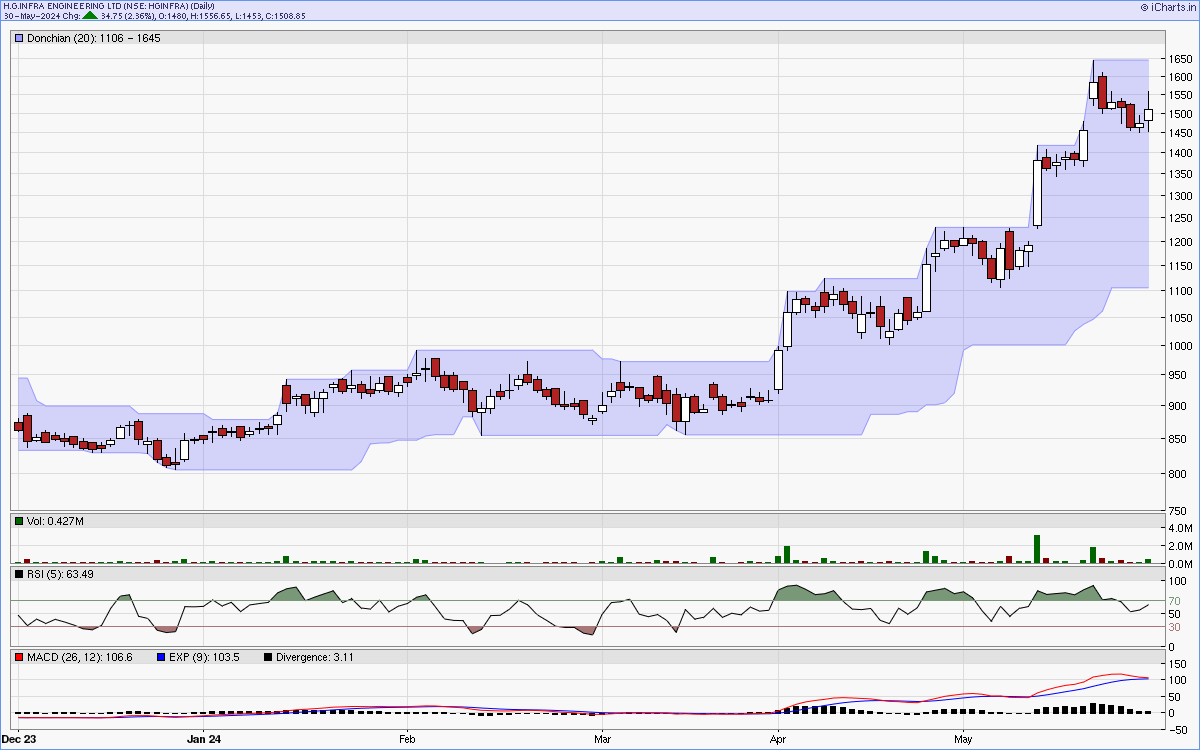
Six months candlestick chart
Charts courtsey: iCharts.in
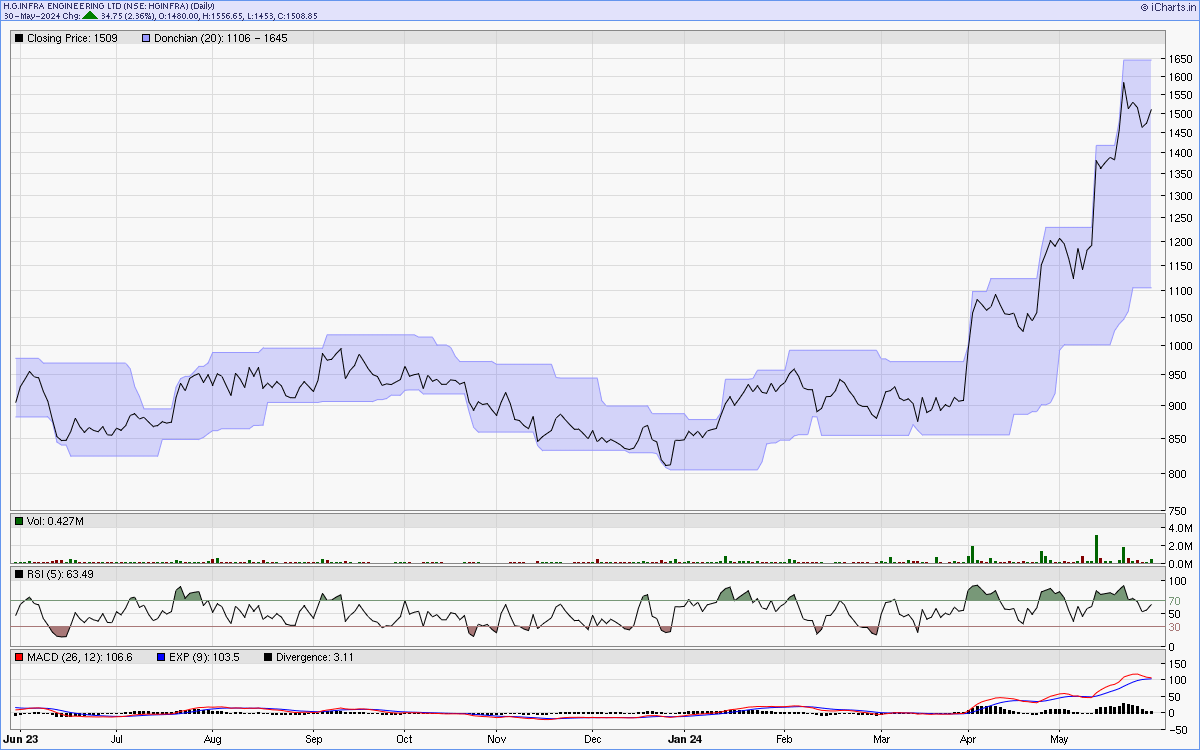
One year line chart
Two years weekly chart
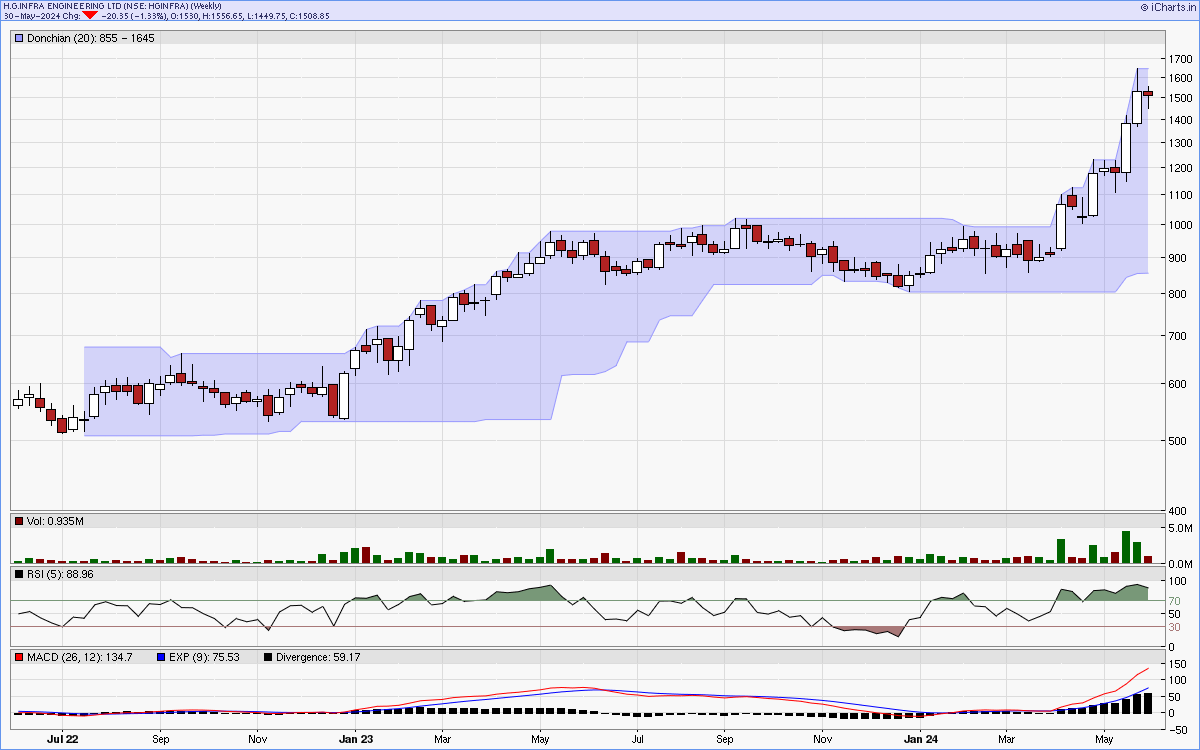
Charts courtsey: iCharts.in