Price / Percentage change:
| Open | High | Low | Close |
| Latest | 303.20 | 305.40 | 296.10 | 297.45 |
| Prev day | 304.50 | 306.95 | 301.70 | 303.20 |
| Last week | 305.55 | 331.20 | 305.55 | 312.55 |
| Last month | 266.40 | 331.20 | 266.40 | 303.60 |
| All time | | 742.00 | 6.36 | |
| 1 Day | 5 Day | 20 Day | 50 Day |
| -1.50% | -3.50% | 4.00% | 3.50% |
Trading range:
| TradingRange | Highest
Close | Lowest
Close | Highest
High | Lowest
Low |
| 5 days | 312.55 | 297.45 | 316.25 | 296.10 |
| 10 days | 319.90 | 297.45 | 331.20 | 296.10 |
| 20 days | 319.90 | 288.65 | 331.20 | 285.30 |
Trend analysis :
| Trend | First Signal | Price | Reversal | P SAR |
| BBB | 05-04-2024 | 306.50 | 285.30 | 328.28 |
| ATR (20d) | Williams R | RSI (5d) | RSI (14d) | Vol | Av Vol (20d) |
| 10.09 | 23 | 30 | 49 | 244000 | 596000
|
Fibonacci price projections:
| 0% | 61.8% | 100% | 161.8% | 261.8% |
| Up | 287.20 | 314.39 | 331.20 | 358.39 | 402.39 |
| Dn | 331.20 | 304.01 | 287.20 | 260.01 | 216.01 |
Intraday pivot levels:
| Sup 2 | Sup 1 | Pivot | Res 1 | Res 2 |
| 290.35 | 293.90 | 299.65 | 303.15 | 308.90 |
Weekly pivot levels:
| Sup 2 | Sup 1 | Pivot | Res 1 | Res 2 |
| 290.75 | 301.55 | 316.40 | 327.20 | 342.00 |
Monthly pivot levels:
| Sup 2 | Sup 1 | Pivot | Res 1 | Res 2 |
| 235.55 | 269.55 | 300.40 | 334.40 | 365.20 |
Moving averages (simple):
| 5 Day | 20 Day | 50 Day | 200 Day |
| 305 | 303 | 288 |
290 |
Other levels:
| 52 Week Hi - Lo | Last Mnth Hi - Lo | Swing Hi - Lo | B Band Hi - Lo |
| 331.20 - 250.10 | 331.20 - 266.40 | 331.20 - 287.20 | 318.60 - 288.16 |
|
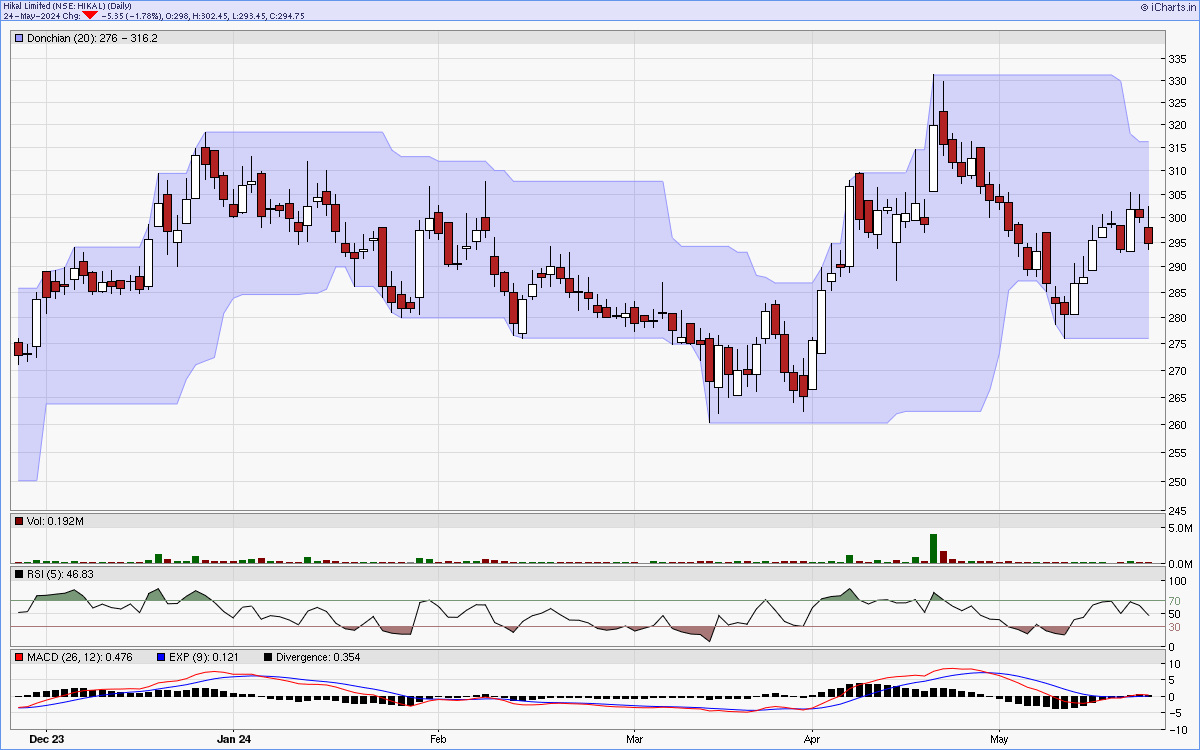
Charts...
Six months candlestick chart
Charts courtsey: iCharts.in
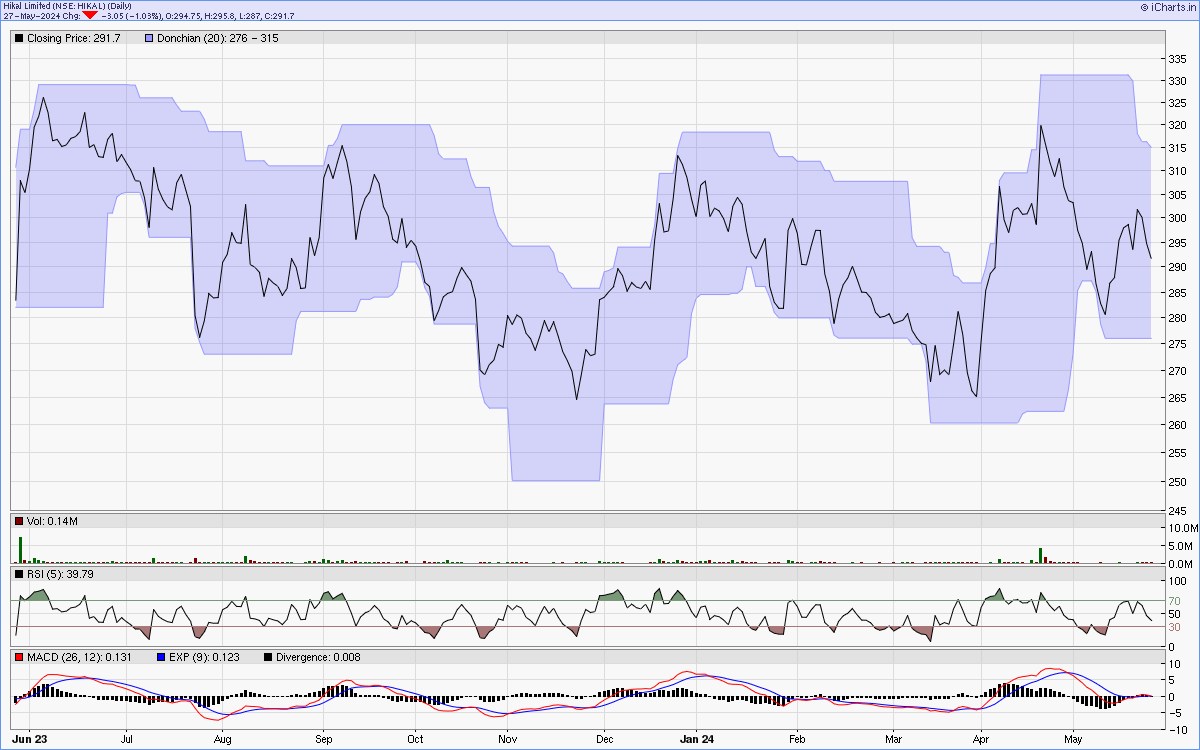
One year line chart
Two years weekly chart
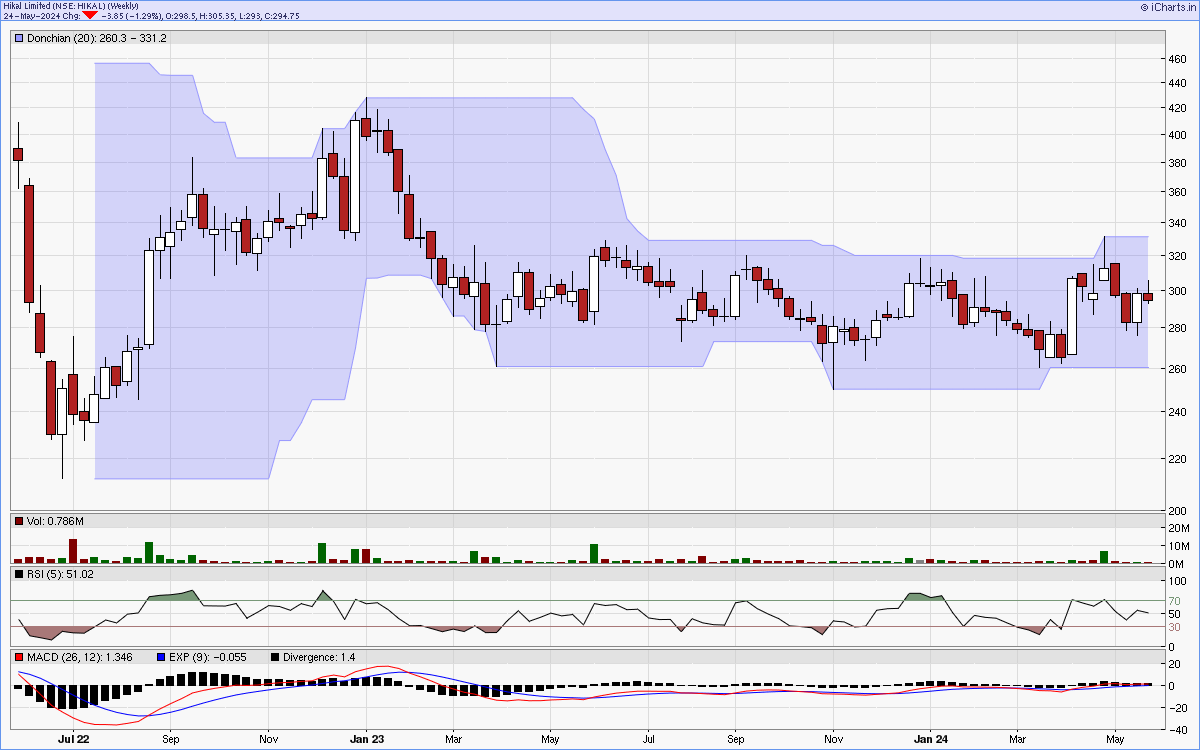
Charts courtsey: iCharts.in