Price / Percentage change:
| Open | High | Low | Close |
| Latest | 650.00 | 655.00 | 629.30 | 638.80 |
| Prev day | 655.05 | 655.05 | 638.40 | 647.10 |
| Last week | 654.95 | 655.40 | 628.65 | 647.10 |
| Last month | 570.00 | 661.60 | 561.55 | 644.40 |
| All time | | 661.60 | 36.75 | |
| 1 Day | 5 Day | 20 Day | 50 Day |
| -1.00% | -1.50% | 10.50% | 23.50% |
Trading range:
| TradingRange | Highest
Close | Lowest
Close | Highest
High | Lowest
Low |
| 5 days | 650.05 | 638.80 | 655.40 | 628.65 |
| 10 days | 650.05 | 611.80 | 661.60 | 608.70 |
| 20 days | 650.05 | 570.05 | 661.60 | 567.60 |
Trend analysis :
| Trend | First Signal | Price | Reversal | P SAR |
| BBB | 22-03-2024 | 547.75 | 567.60 | 660.30 |
| ATR (20d) | Williams R | RSI (5d) | RSI (14d) | Vol | Av Vol (20d) |
| 16.28 | 63 | 53 | 67 | 10094000 | 9832000
|
Fibonacci price projections:
| 0% | 61.8% | 100% | 161.8% | 261.8% |
| Up | 501.20 | 527.19 | 543.25 | 569.24 | 611.29 |
| Dn | 543.25 | 517.26 | 501.20 | 475.21 | 433.16 |
Intraday pivot levels:
| Sup 2 | Sup 1 | Pivot | Res 1 | Res 2 |
| 615.30 | 627.00 | 641.00 | 652.70 | 666.70 |
Weekly pivot levels:
| Sup 2 | Sup 1 | Pivot | Res 1 | Res 2 |
| 616.95 | 632.00 | 643.70 | 658.75 | 670.45 |
Monthly pivot levels:
| Sup 2 | Sup 1 | Pivot | Res 1 | Res 2 |
| 522.40 | 583.40 | 622.50 | 683.45 | 722.55 |
Moving averages (simple):
| 5 Day | 20 Day | 50 Day | 200 Day |
| 644 | 617 | 566 |
519 |
Other levels:
| 52 Week Hi - Lo | Last Mnth Hi - Lo | Swing Hi - Lo | B Band Hi - Lo |
| 661.60 - 397.80 | 661.60 - 561.55 | 543.25 - 501.20 | 668.31 - 566.52 |
|
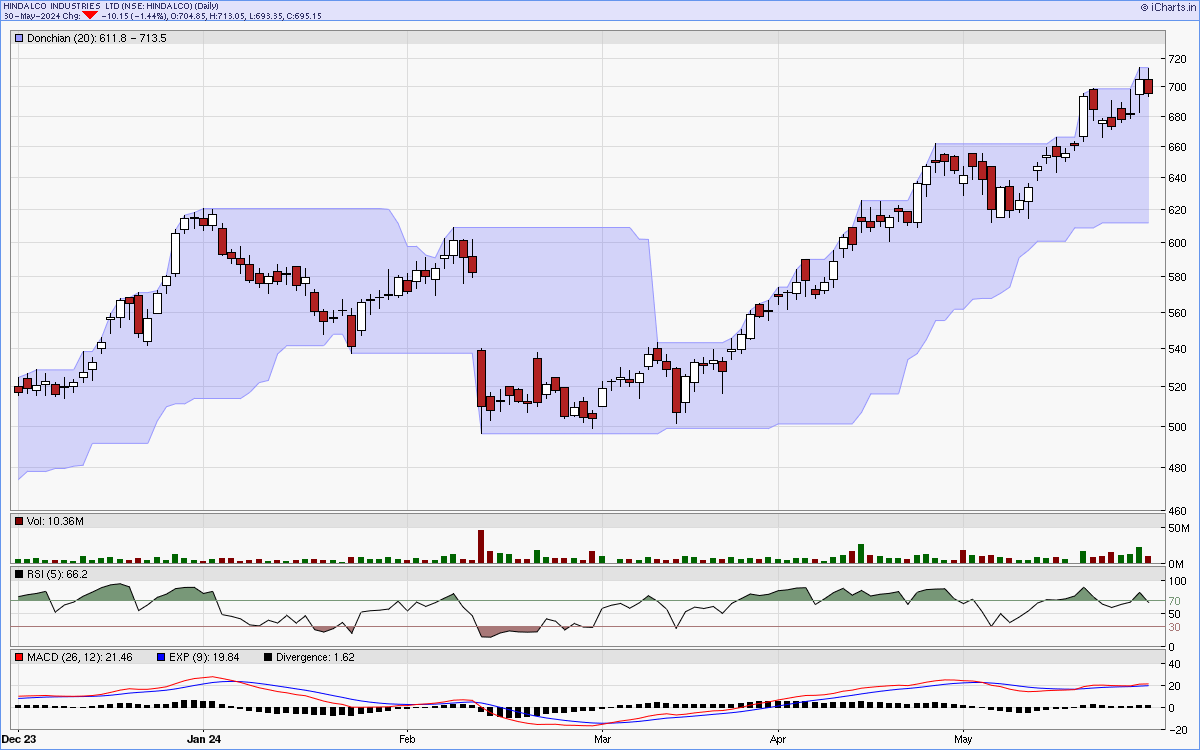
Charts...
Six months candlestick chart
Charts courtsey: iCharts.in
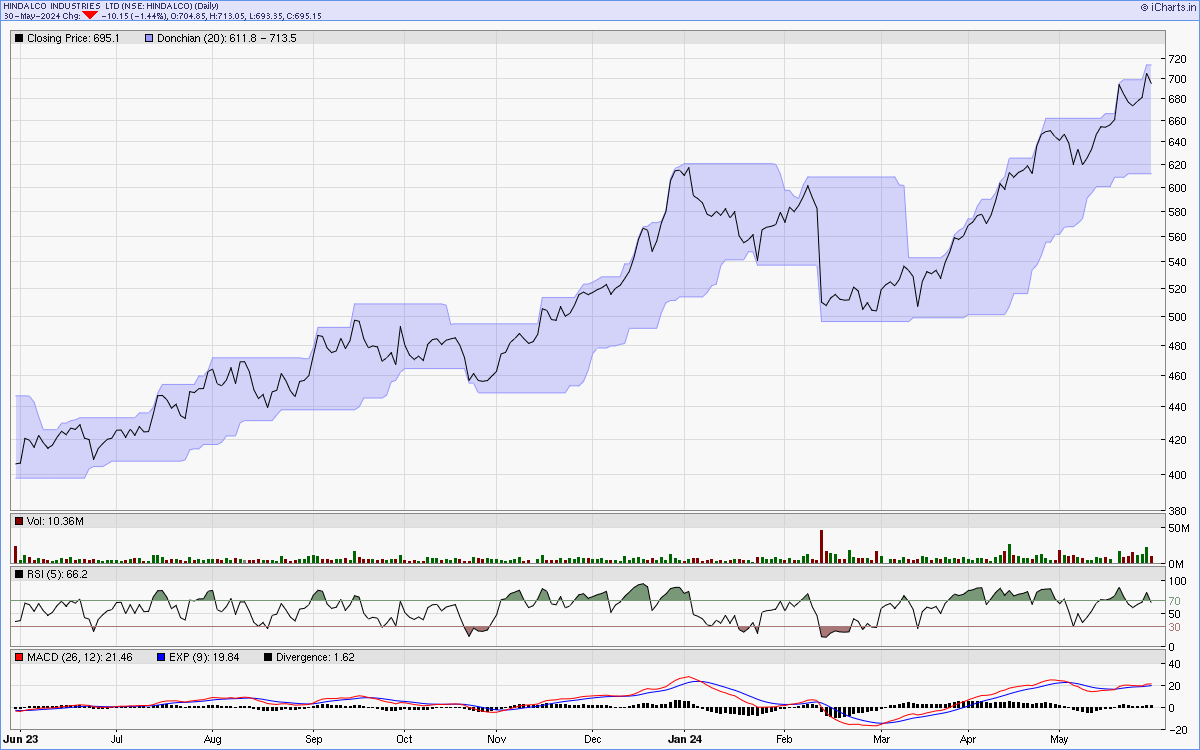
One year line chart
Two years weekly chart
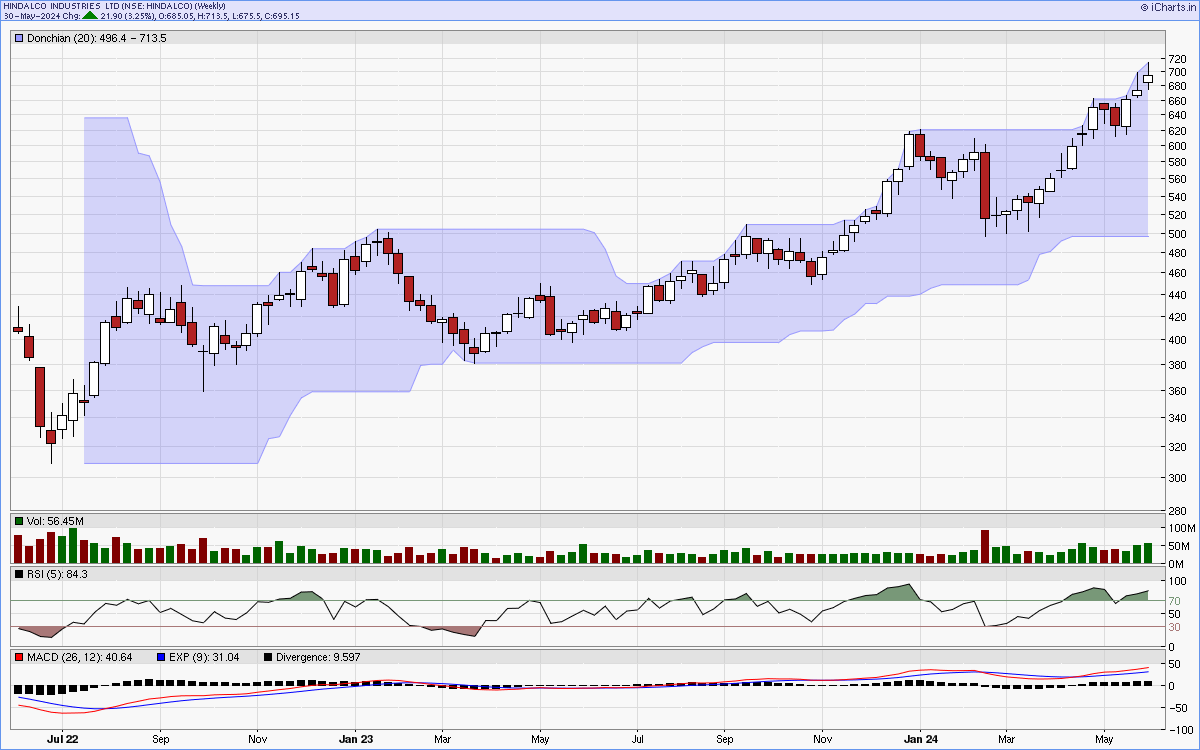
Charts courtsey: iCharts.in