Price / Percentage change:
| Open | High | Low | Close |
| Latest | 393.00 | 393.35 | 374.60 | 387.60 |
| Prev day | 386.00 | 395.00 | 384.80 | 391.45 |
| Last week | 371.30 | 397.00 | 371.10 | 391.00 |
| Last month | 280.15 | 401.65 | 280.15 | 386.00 |
| All time | | 645.25 | 18.25 | |
| 1 Day | 5 Day | 20 Day | 50 Day |
| -0.50% | 1.50% | 25.00% | 51.00% |
Trading range:
| TradingRange | Highest
Close | Lowest
Close | Highest
High | Lowest
Low |
| 5 days | 391.45 | 386.00 | 401.65 | 374.60 |
| 10 days | 391.45 | 364.10 | 401.65 | 346.50 |
| 20 days | 391.45 | 311.45 | 401.65 | 306.10 |
Trend analysis :
| Trend | First Signal | Price | Reversal | P SAR |
| BBB | 01-04-2024 | 309.85 | 306.10 | 359.75 |
| ATR (20d) | Williams R | RSI (5d) | RSI (14d) | Vol | Av Vol (20d) |
| 15.75 | 75 | 65 | 71 | 12629000 | 18343000
|
Fibonacci price projections:
| 0% | 61.8% | 100% | 161.8% | 261.8% |
| Up | 273.30 | 347.89 | 394.00 | 468.59 | 589.29 |
| Dn | 394.00 | 319.41 | 273.30 | 198.71 | 78.01 |
Intraday pivot levels:
| Sup 2 | Sup 1 | Pivot | Res 1 | Res 2 |
| 366.40 | 376.90 | 385.15 | 395.65 | 403.90 |
Weekly pivot levels:
| Sup 2 | Sup 1 | Pivot | Res 1 | Res 2 |
| 360.45 | 375.70 | 386.35 | 401.60 | 412.25 |
Monthly pivot levels:
| Sup 2 | Sup 1 | Pivot | Res 1 | Res 2 |
| 234.40 | 310.15 | 355.90 | 431.65 | 477.40 |
Moving averages (simple):
| 5 Day | 20 Day | 50 Day | 200 Day |
| 389 | 362 | 306 |
214 |
Other levels:
| 52 Week Hi - Lo | Last Mnth Hi - Lo | Swing Hi - Lo | B Band Hi - Lo |
| 401.65 - 100.50 | 401.65 - 280.15 | 394.00 - 273.30 | 411.76 - 312.74 |
|
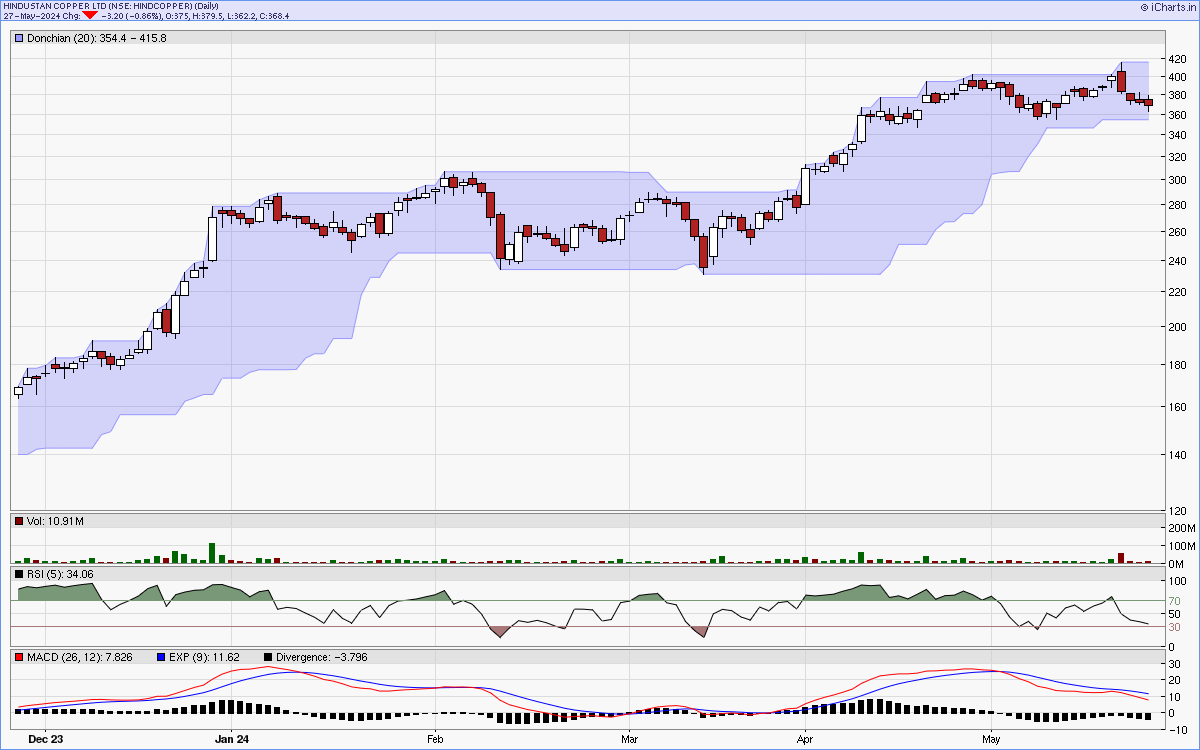
Charts...
Six months candlestick chart
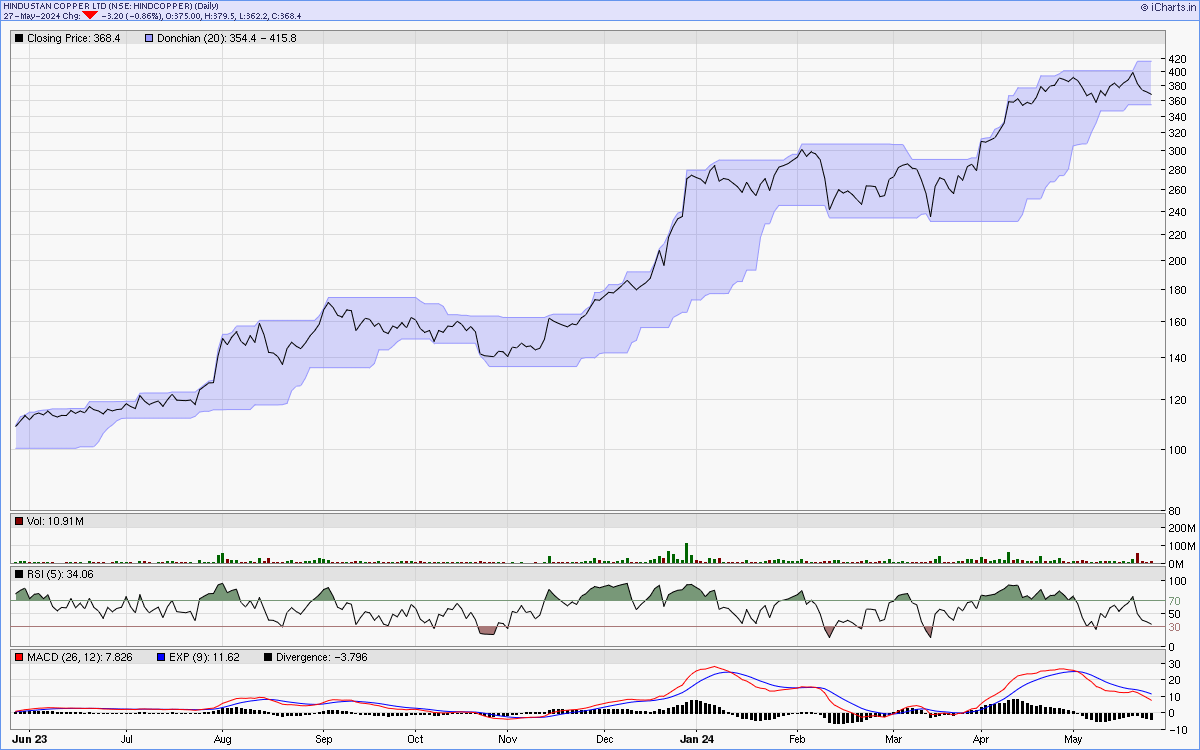
Charts courtsey: iCharts.in
One year line chart
Two years weekly chart
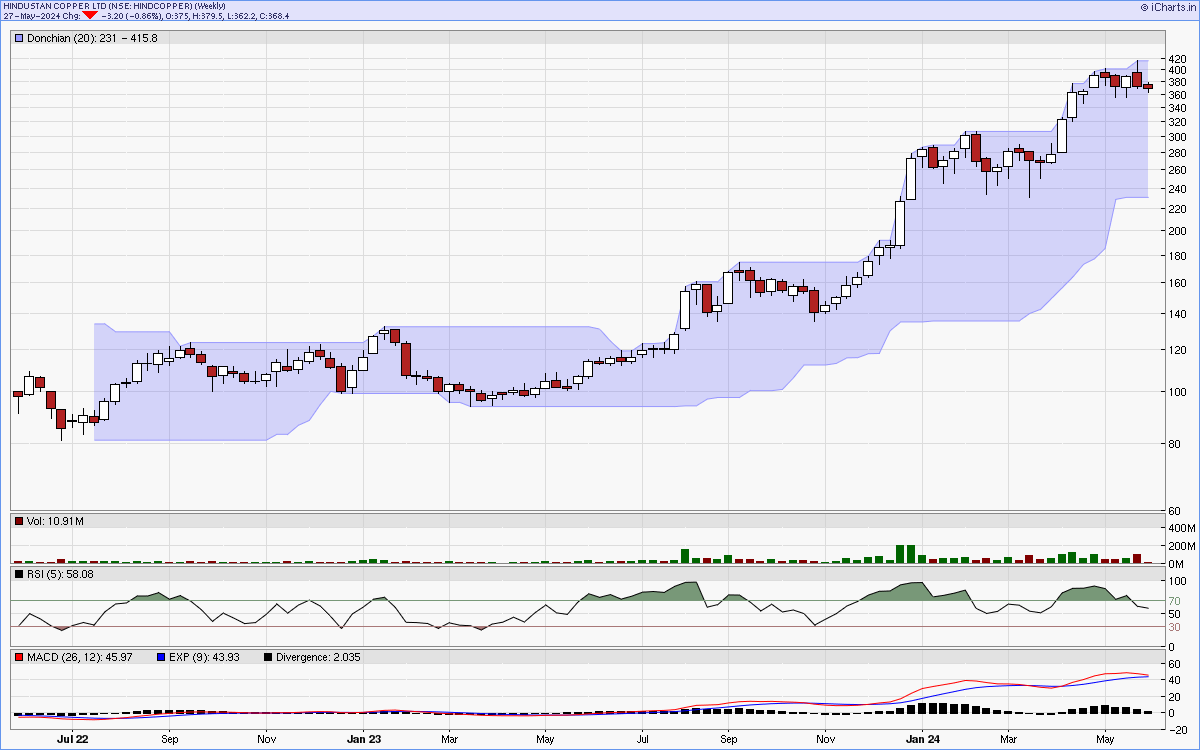
Charts courtsey: iCharts.in