Price / Percentage change:
| Open | High | Low | Close |
| Latest | 35.40 | 38.10 | 35.25 | 38.10 |
| Prev day | 31.90 | 34.65 | 31.15 | 34.65 |
| Last week | 23.95 | 34.30 | 23.55 | 28.65 |
| Last month | 16.95 | 34.65 | 16.40 | 34.65 |
| All time | | 38.10 | 4.65 | |
| 1 Day | 5 Day | 20 Day | 50 Day |
| 9.50% | 30.50% | 120.50% | 93.00% |
Trading range:
| TradingRange | Highest
Close | Lowest
Close | Highest
High | Lowest
Low |
| 5 days | 38.10 | 28.65 | 38.10 | 28.20 |
| 10 days | 38.10 | 20.50 | 38.10 | 19.60 |
| 20 days | 38.10 | 18.30 | 38.10 | 17.20 |
Trend analysis :
| Trend | First Signal | Price | Reversal | P SAR |
| BBB | 08-04-2024 | 20.50 | 17.20 | 27.20 |
| ATR (20d) | Williams R | RSI (5d) | RSI (14d) | Vol | Av Vol (20d) |
| 2.17 | 100 | 87 | 80 | 13724000 | 8830000
|
Fibonacci price projections:
| 0% | 61.8% | 100% | 161.8% | 261.8% |
| Up | 28.20 | 31.97 | 34.30 | 38.07 | 44.17 |
| Dn | 34.30 | 30.53 | 28.20 | 24.43 | 18.33 |
Intraday pivot levels:
| Sup 2 | Sup 1 | Pivot | Res 1 | Res 2 |
| 34.30 | 36.15 | 37.15 | 39.05 | 40.00 |
Weekly pivot levels:
| Sup 2 | Sup 1 | Pivot | Res 1 | Res 2 |
| 18.05 | 23.30 | 28.80 | 34.05 | 39.55 |
Monthly pivot levels:
| Sup 2 | Sup 1 | Pivot | Res 1 | Res 2 |
| 10.30 | 22.45 | 28.55 | 40.70 | 46.80 |
Moving averages (simple):
| 5 Day | 20 Day | 50 Day | 200 Day |
| 33 | 25 | 21 |
17 |
Other levels:
| 52 Week Hi - Lo | Last Mnth Hi - Lo | Swing Hi - Lo | B Band Hi - Lo |
| 38.10 - 12.65 | 34.65 - 16.40 | 34.30 - 28.20 | 36.65 - 12.59 |
|
Charts...
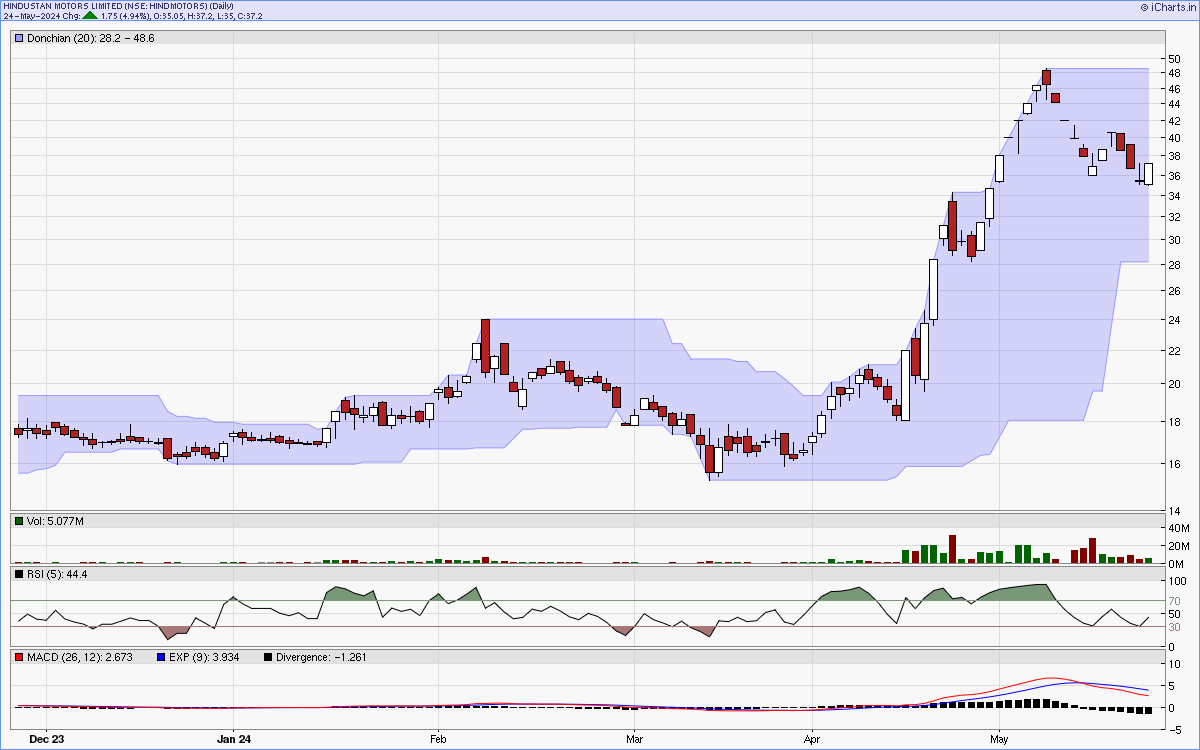
Six months candlestick chart
Charts courtsey: iCharts.in
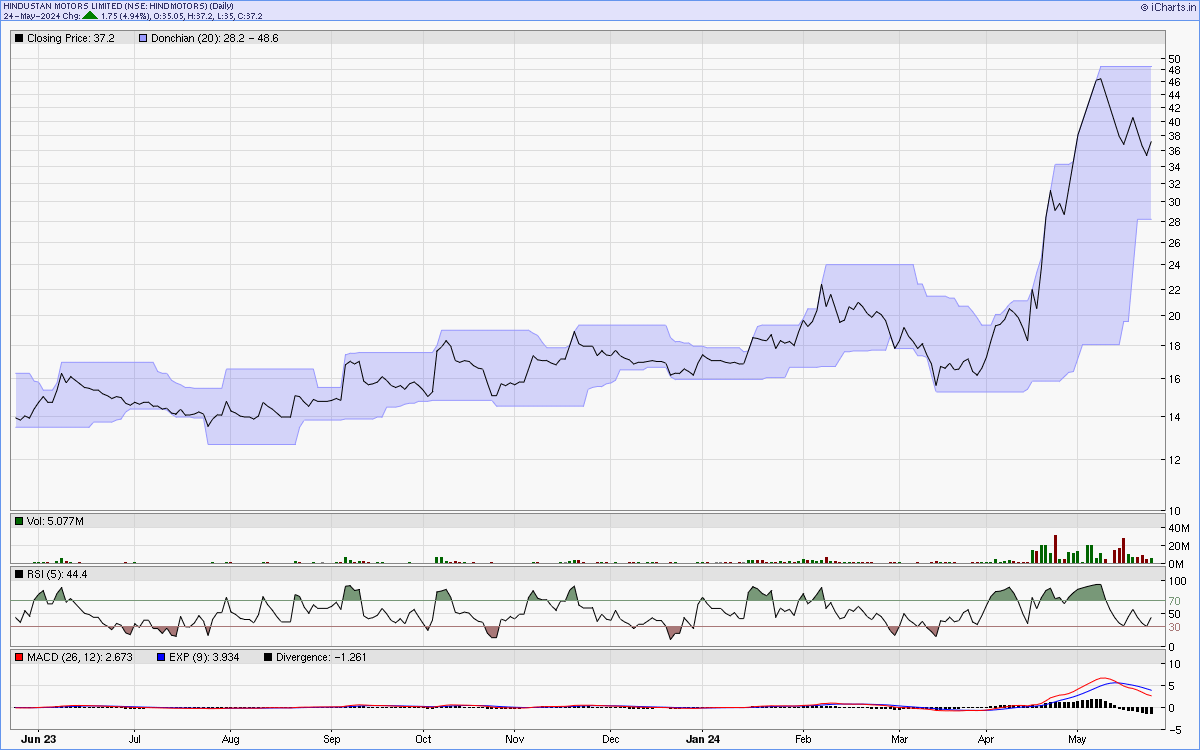
One year line chart
Two years weekly chart
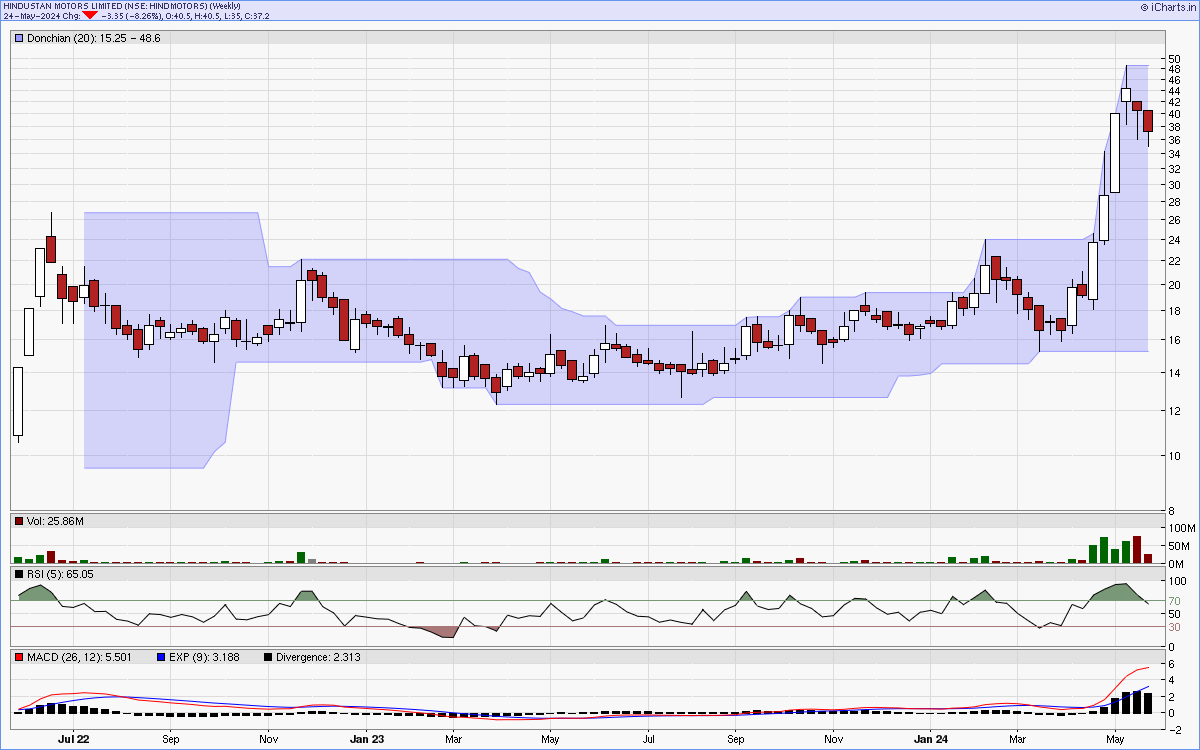
Charts courtsey: iCharts.in