Price / Percentage change:
| Open | High | Low | Close |
| Latest | 1141.55 | 1158.45 | 1138.10 | 1146.30 |
| Prev day | 1141.30 | 1157.40 | 1135.45 | 1142.05 |
| Last week | 1108.00 | 1169.55 | 1107.90 | 1142.05 |
| Last month | 1096.05 | 1169.55 | 1048.10 | 1150.40 |
| All time | | 1169.55 | 12.00 | |
| 1 Day | 5 Day | 20 Day | 50 Day |
| 0.00% | 3.00% | 6.00% | 12.00% |
Trading range:
| TradingRange | Highest
Close | Lowest
Close | Highest
High | Lowest
Low |
| 5 days | 1160.15 | 1139.45 | 1169.55 | 1107.90 |
| 10 days | 1160.15 | 1086.65 | 1169.55 | 1070.35 |
| 20 days | 1160.15 | 1055.45 | 1169.55 | 1048.10 |
Trend analysis :
| Trend | First Signal | Price | Reversal | P SAR |
| BBB | 29-04-2024 | 1160.15 | 1048.10 | 1074.96 |
| ATR (20d) | Williams R | RSI (5d) | RSI (14d) | Vol | Av Vol (20d) |
| 21.88 | 81 | 69 | 65 | 14971000 | 15374000
|
Fibonacci price projections:
| 0% | 61.8% | 100% | 161.8% | 261.8% |
| Up | 1048.10 | 1090.40 | 1116.55 | 1158.85 | 1227.30 |
| Dn | 1116.55 | 1074.25 | 1048.10 | 1005.80 | 937.35 |
Intraday pivot levels:
| Sup 2 | Sup 1 | Pivot | Res 1 | Res 2 |
| 1127.20 | 1136.70 | 1147.60 | 1157.10 | 1167.95 |
Weekly pivot levels:
| Sup 2 | Sup 1 | Pivot | Res 1 | Res 2 |
| 1078.15 | 1110.05 | 1139.80 | 1171.65 | 1201.40 |
Monthly pivot levels:
| Sup 2 | Sup 1 | Pivot | Res 1 | Res 2 |
| 1001.20 | 1075.75 | 1122.65 | 1197.20 | 1244.10 |
Moving averages (simple):
| 5 Day | 20 Day | 50 Day | 200 Day |
| 1148 | 1104 | 1087 |
1002 |
Other levels:
| 52 Week Hi - Lo | Last Mnth Hi - Lo | Swing Hi - Lo | B Band Hi - Lo |
| 1169.55 - 899.00 | 1169.55 - 1048.10 | 1116.55 - 1048.10 | 1162.86 - 1044.34 |
|
Charts...
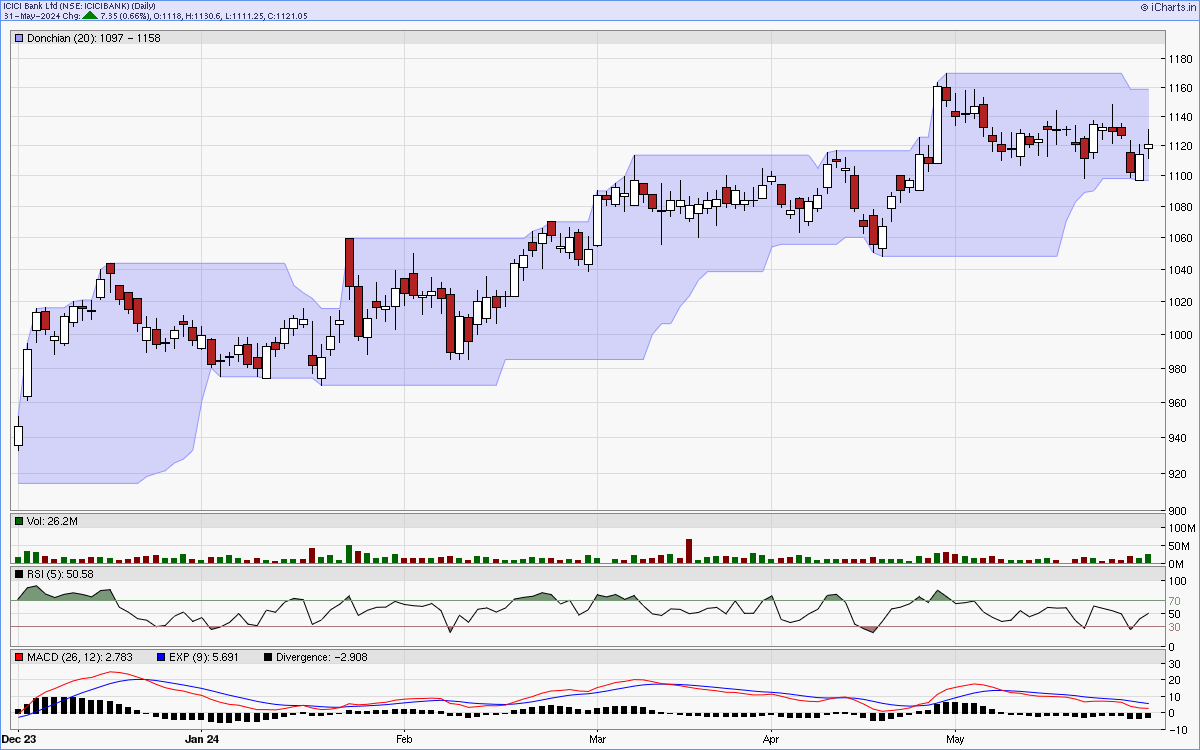
Six months candlestick chart
Charts courtsey: iCharts.in
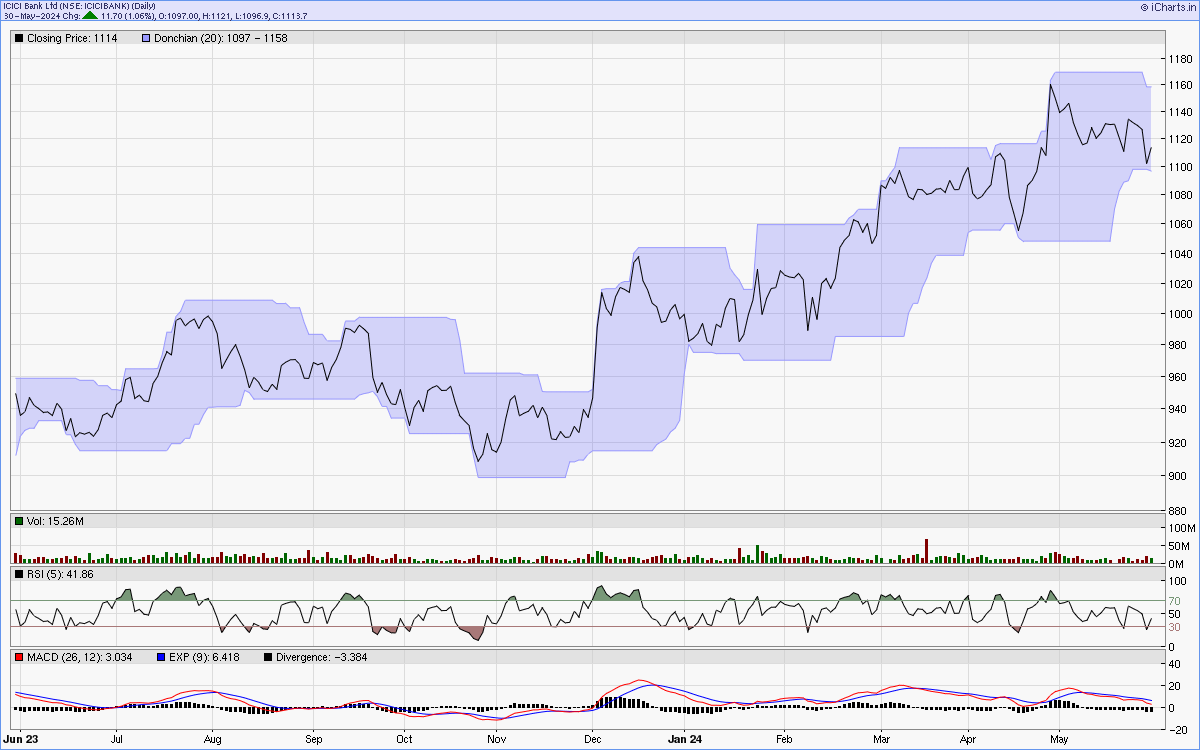
One year line chart
Two years weekly chart
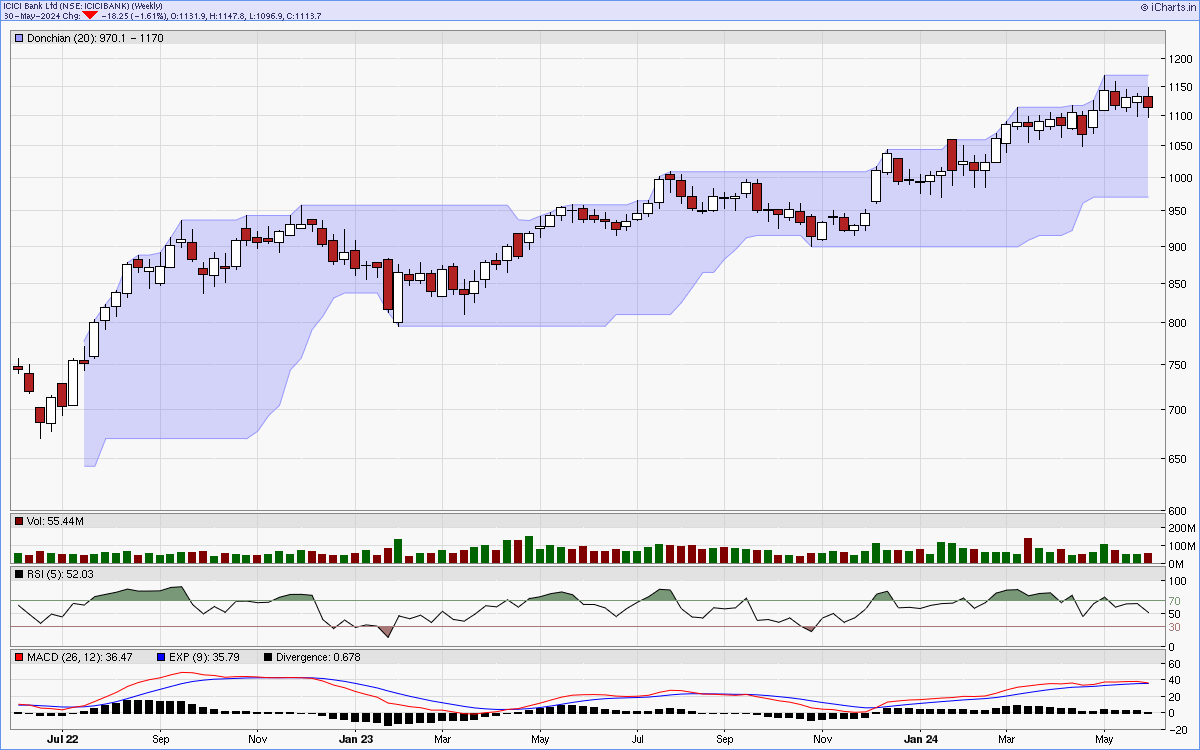
Charts courtsey: iCharts.in