Price / Percentage change:
| Open | High | Low | Close |
| Latest | 246.95 | 258.50 | 244.50 | 256.20 |
| Prev day | 244.55 | 250.00 | 240.75 | 245.35 |
| Last week | 255.25 | 280.00 | 245.00 | 253.35 |
| Last month | 199.85 | 280.00 | 199.85 | 243.55 |
| All time | | 607.80 | 103.15 | |
| 1 Day | 5 Day | 20 Day | 50 Day |
| 4.00% | 1.50% | 22.00% | 42.00% |
Trading range:
| TradingRange | Highest
Close | Lowest
Close | Highest
High | Lowest
Low |
| 5 days | 256.20 | 243.55 | 259.00 | 239.70 |
| 10 days | 269.45 | 243.55 | 280.00 | 239.70 |
| 20 days | 269.45 | 220.25 | 280.00 | 220.25 |
Trend analysis :
| Trend | First Signal | Price | Reversal | P SAR |
| BBB | 26-02-2024 | 210.10 | 220.25 | 272.77 |
| ATR (20d) | Williams R | RSI (5d) | RSI (14d) | Vol | Av Vol (20d) |
| 13.53 | 54 | 65 | 62 | 233000 | 250000
|
Fibonacci price projections:
| 0% | 61.8% | 100% | 161.8% | 261.8% |
| Up | 228.00 | 260.14 | 280.00 | 312.14 | 364.14 |
| Dn | 280.00 | 247.86 | 228.00 | 195.86 | 143.86 |
Intraday pivot levels:
| Sup 2 | Sup 1 | Pivot | Res 1 | Res 2 |
| 239.05 | 247.60 | 253.05 | 261.60 | 267.05 |
Weekly pivot levels:
| Sup 2 | Sup 1 | Pivot | Res 1 | Res 2 |
| 224.45 | 238.90 | 259.45 | 273.90 | 294.45 |
Monthly pivot levels:
| Sup 2 | Sup 1 | Pivot | Res 1 | Res 2 |
| 160.95 | 202.20 | 241.10 | 282.35 | 321.25 |
Moving averages (simple):
| 5 Day | 20 Day | 50 Day | 200 Day |
| 249 | 246 | 218 |
186 |
Other levels:
| 52 Week Hi - Lo | Last Mnth Hi - Lo | Swing Hi - Lo | B Band Hi - Lo |
| 280.00 - 120.00 | 280.00 - 199.85 | 280.00 - 228.00 | 266.64 - 225.23 |
|
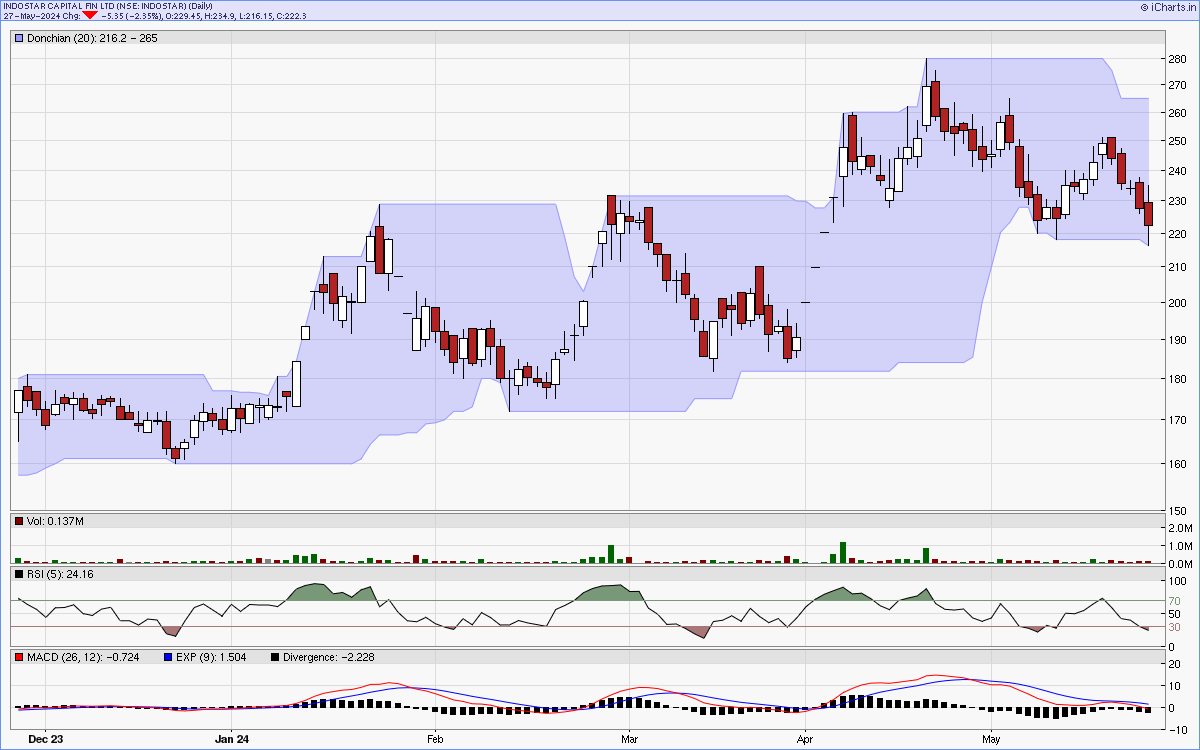
Charts...
Six months candlestick chart
Charts courtsey: iCharts.in
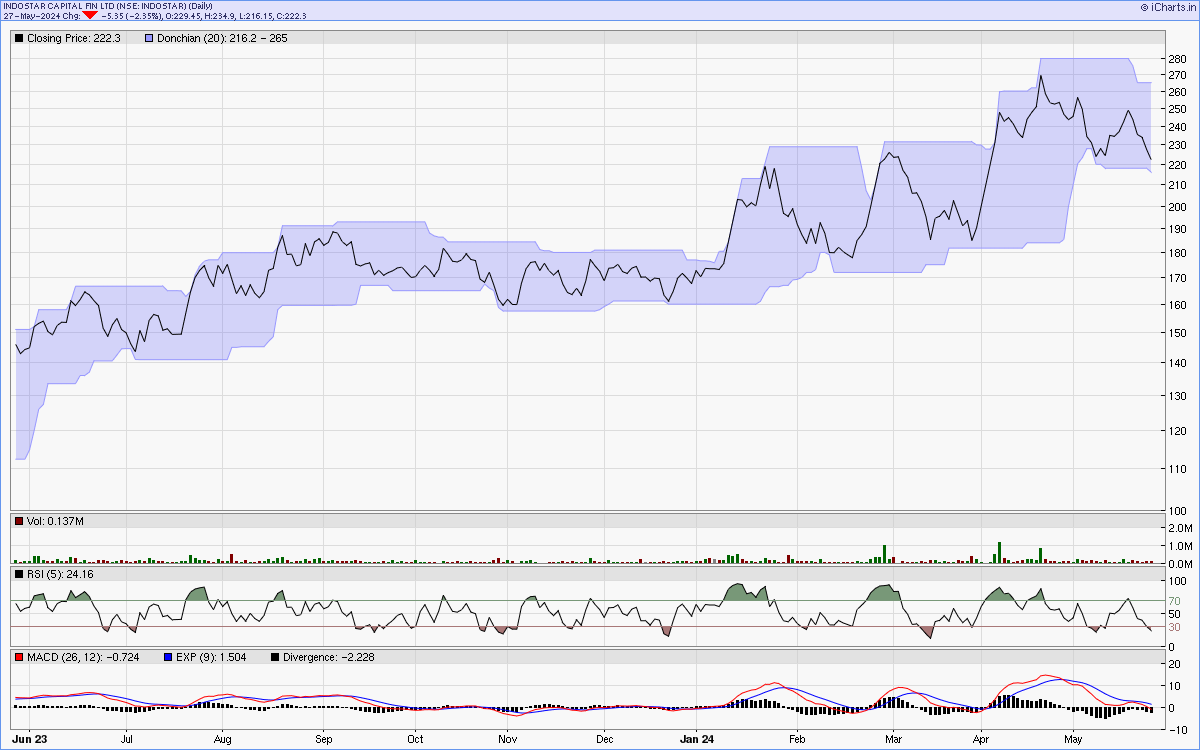
One year line chart
Two years weekly chart
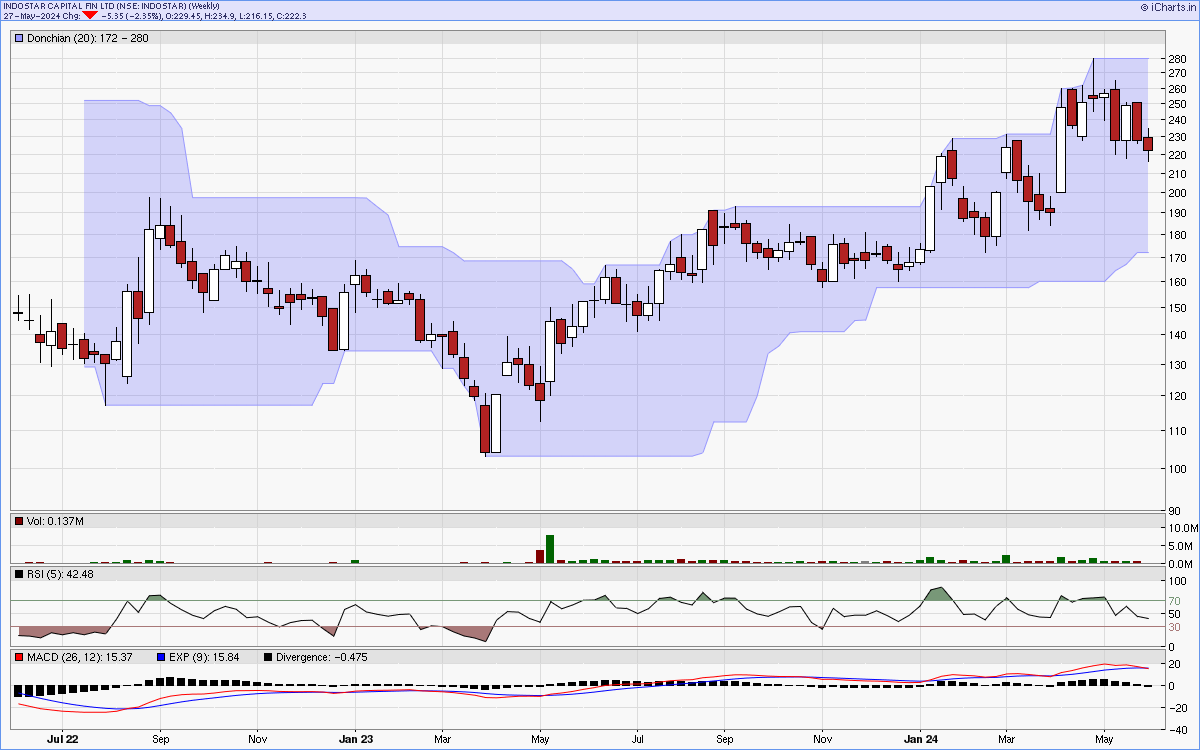
Charts courtsey: iCharts.in