Price / Percentage change:
| Open | High | Low | Close |
| Latest | 543.95 | 543.95 | 529.75 | 531.50 |
| Prev day | 555.50 | 565.00 | 530.15 | 536.10 |
| Last week | 593.00 | 641.00 | 560.00 | 567.85 |
| Last month | 476.35 | 641.00 | 458.20 | 536.10 |
| All time | | 641.00 | 435.05 | |
| 1 Day | 5 Day | 20 Day | 50 Day |
| -0.50% | -10.00% | 10.50% | -3.00% |
Trading range:
| TradingRange | Highest
Close | Lowest
Close | Highest
High | Lowest
Low |
| 5 days | 575.90 | 531.50 | 590.95 | 529.75 |
| 10 days | 604.45 | 465.85 | 641.00 | 464.00 |
| 20 days | 604.45 | 463.90 | 641.00 | 458.20 |
Trend analysis :
| Trend | First Signal | Price | Reversal | P SAR |
| BBB | 19-04-2024 | 559.00 | 458.20 | 503.23 |
| ATR (20d) | Williams R | RSI (5d) | RSI (14d) | Vol | Av Vol (20d) |
| 28.38 | 40 | 39 | 51 | 79000 | 342000
|
Fibonacci price projections:
| 0% | 61.8% | 100% | 161.8% | 261.8% |
| Up | 458.20 | 571.17 | 641.00 | 753.97 | 936.77 |
| Dn | 641.00 | 528.03 | 458.20 | 345.23 | 162.43 |
Intraday pivot levels:
| Sup 2 | Sup 1 | Pivot | Res 1 | Res 2 |
| 520.80 | 526.10 | 535.05 | 540.30 | 549.25 |
Weekly pivot levels:
| Sup 2 | Sup 1 | Pivot | Res 1 | Res 2 |
| 508.60 | 538.20 | 589.60 | 619.20 | 670.60 |
Monthly pivot levels:
| Sup 2 | Sup 1 | Pivot | Res 1 | Res 2 |
| 362.30 | 449.20 | 545.10 | 632.00 | 727.90 |
Moving averages (simple):
| 5 Day | 20 Day | 50 Day | 200 Day |
| 553 | 520 | 519 |
|
Other levels:
| 52 Week Hi - Lo | Last Mnth Hi - Lo | Swing Hi - Lo | B Band Hi - Lo |
| 641.00 - 435.05 | 641.00 - 458.20 | 641.00 - 458.20 | 610.86 - 428.72 |
|
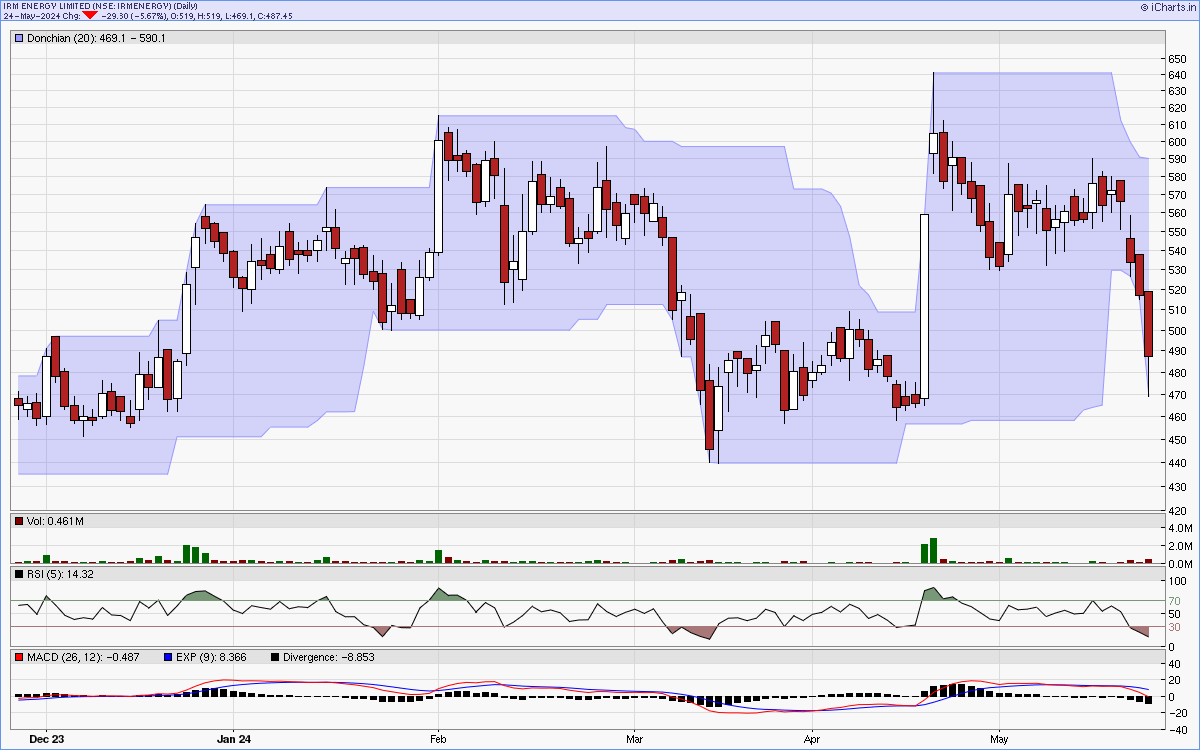
Charts...
Six months candlestick chart
Charts courtsey: iCharts.in
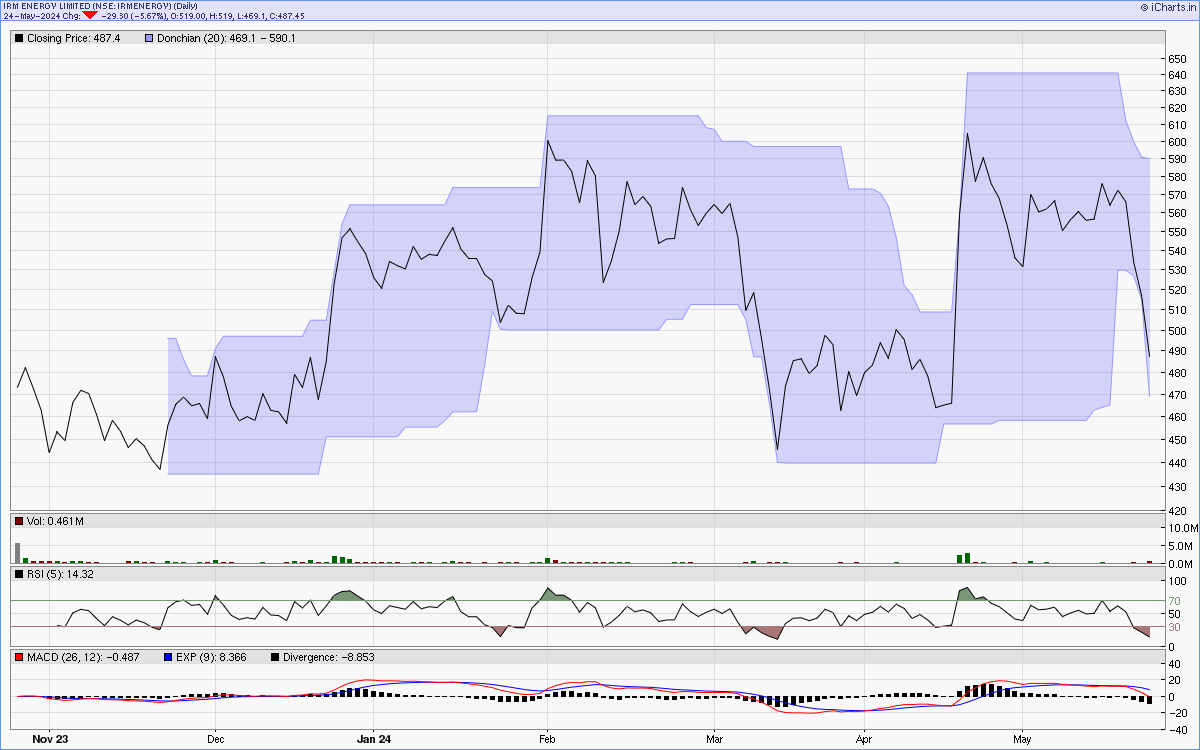
One year line chart
Two years weekly chart
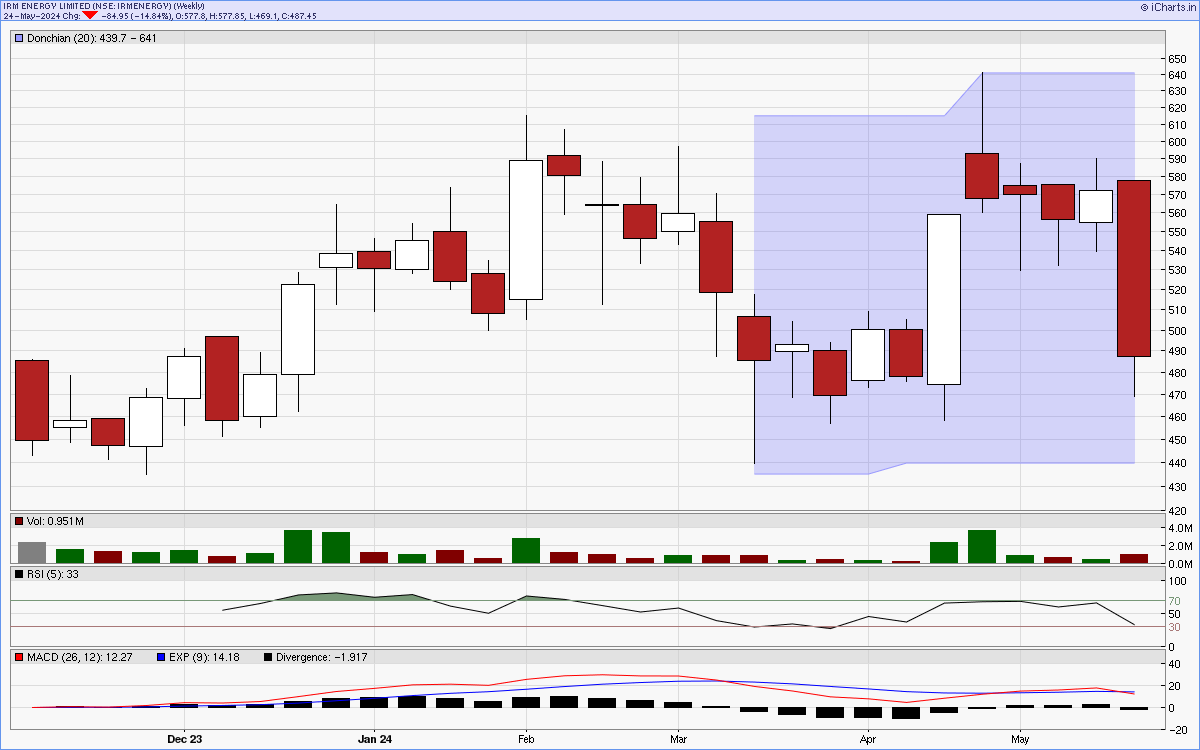
Charts courtsey: iCharts.in