Price / Percentage change:
| Open | High | Low | Close |
| Latest | 1087.85 | 1087.85 | 1045.00 | 1050.15 |
| Prev day | 1110.00 | 1113.00 | 1071.70 | 1087.85 |
| Last week | 1000.10 | 1107.90 | 1000.10 | 1099.55 |
| Last month | 897.95 | 1140.00 | 897.95 | 1097.70 |
| All time | | 1178.25 | 417.85 | |
| 1 Day | 5 Day | 20 Day | 50 Day |
| -3.00% | -1.50% | 12.50% | 19.00% |
Trading range:
| TradingRange | Highest
Close | Lowest
Close | Highest
High | Lowest
Low |
| 5 days | 1122.35 | 1050.15 | 1140.00 | 1045.00 |
| 10 days | 1122.35 | 1001.05 | 1140.00 | 980.00 |
| 20 days | 1122.35 | 921.45 | 1140.00 | 908.85 |
Trend analysis :
| Trend | First Signal | Price | Reversal | P SAR |
| BBB | 03-04-2024 | 966.80 | 908.85 | 1138.63 |
| ATR (20d) | Williams R | RSI (5d) | RSI (14d) | Vol | Av Vol (20d) |
| 42.79 | 57 | 43 | 58 | 73000 | 161000
|
Fibonacci price projections:
| 0% | 61.8% | 100% | 161.8% | 261.8% |
| Up | 909.95 | 1052.12 | 1140.00 | 1282.17 | 1512.22 |
| Dn | 1140.00 | 997.83 | 909.95 | 767.78 | 537.73 |
Intraday pivot levels:
| Sup 2 | Sup 1 | Pivot | Res 1 | Res 2 |
| 1018.15 | 1034.15 | 1061.00 | 1077.00 | 1103.85 |
Weekly pivot levels:
| Sup 2 | Sup 1 | Pivot | Res 1 | Res 2 |
| 961.35 | 1030.40 | 1069.15 | 1138.20 | 1176.95 |
Monthly pivot levels:
| Sup 2 | Sup 1 | Pivot | Res 1 | Res 2 |
| 803.15 | 950.40 | 1045.20 | 1192.45 | 1287.25 |
Moving averages (simple):
| 5 Day | 20 Day | 50 Day | 200 Day |
| 1092 | 1015 | 932 |
851 |
Other levels:
| 52 Week Hi - Lo | Last Mnth Hi - Lo | Swing Hi - Lo | B Band Hi - Lo |
| 1178.25 - 475.95 | 1140.00 - 897.95 | 1140.00 - 909.95 | 1131.91 - 897.37 |
|
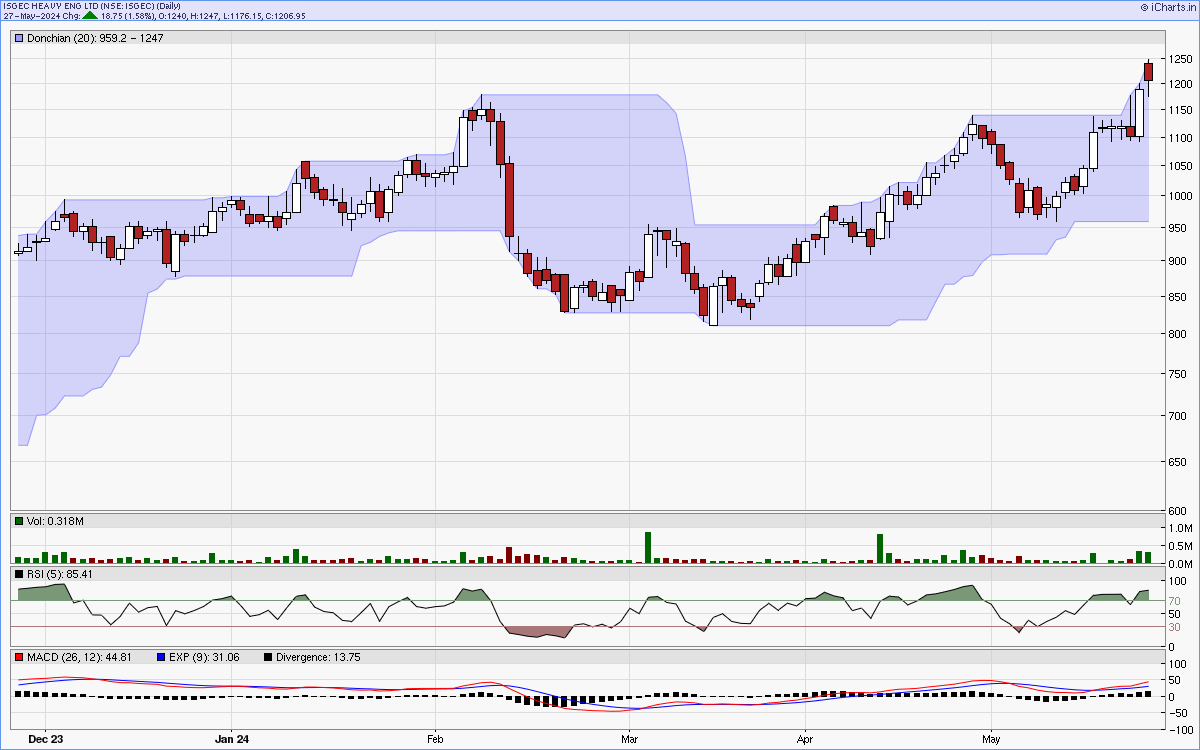
Charts...
Six months candlestick chart
Charts courtsey: iCharts.in
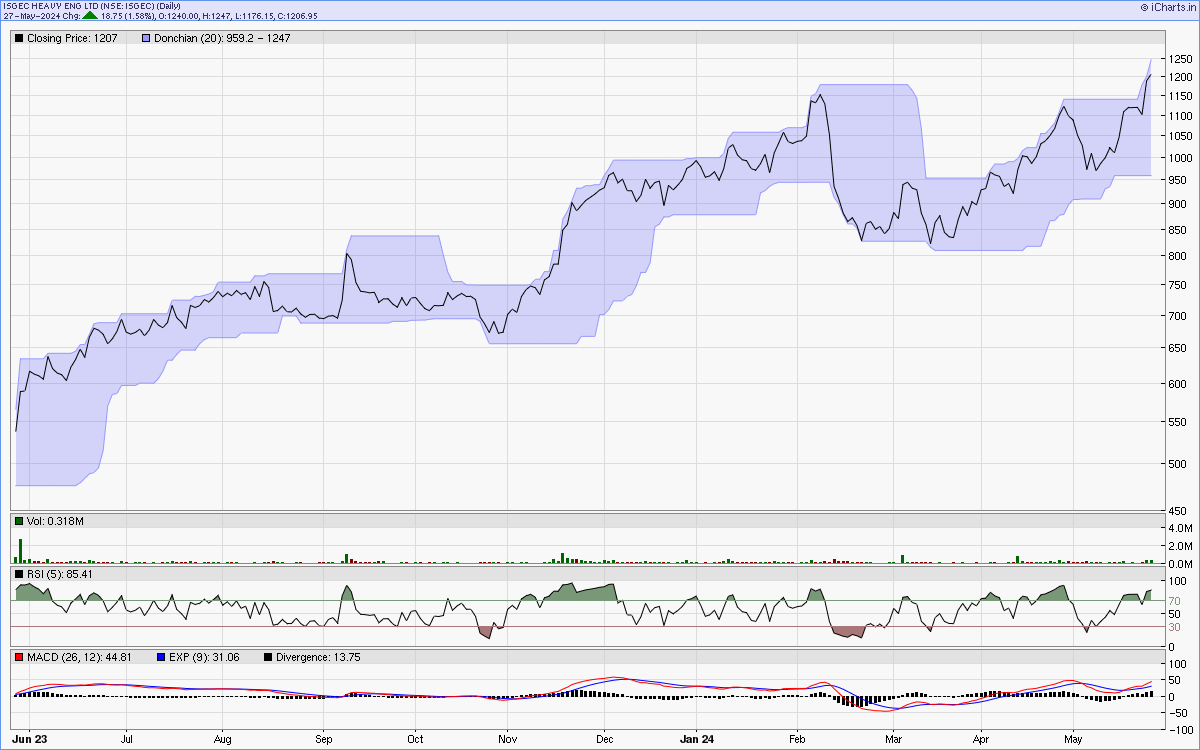
One year line chart
Two years weekly chart
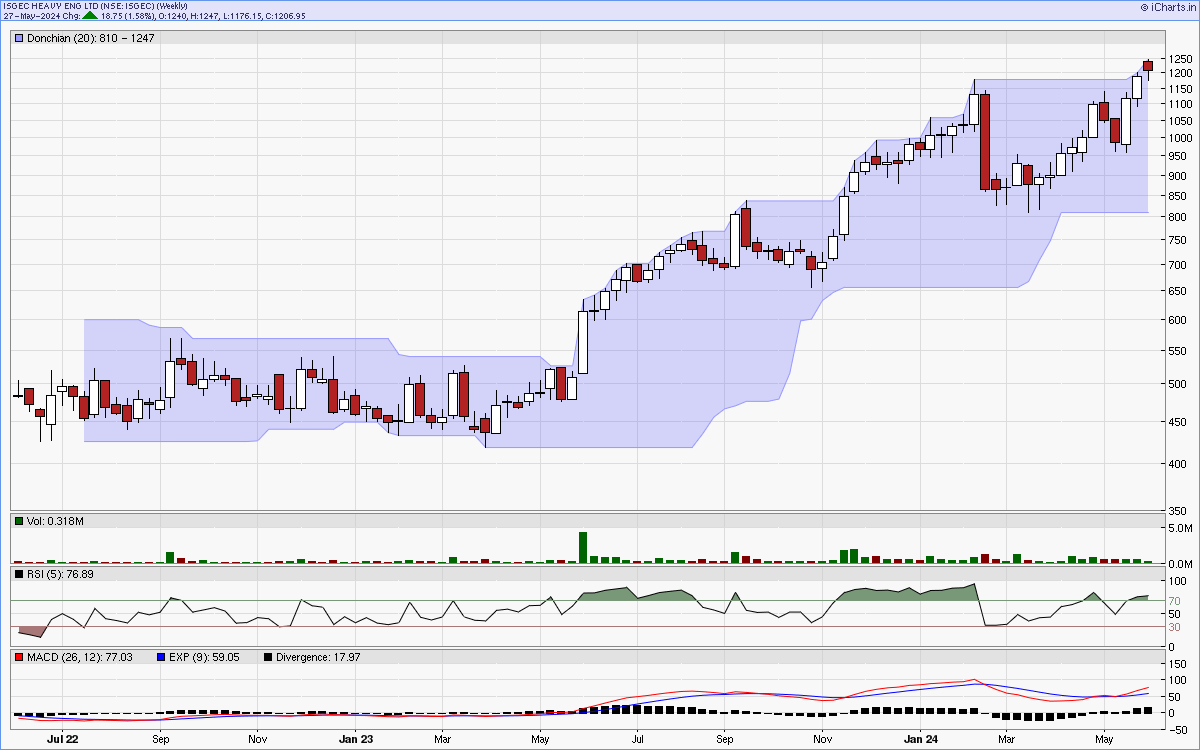
Charts courtsey: iCharts.in