Price / Percentage change:
| Open | High | Low | Close |
| Latest | 258.40 | 262.80 | 245.85 | 248.35 |
| Prev day | 262.70 | 264.65 | 253.60 | 258.40 |
| Last week | 252.65 | 274.50 | 251.15 | 258.40 |
| Last month | 172.25 | 274.50 | 172.25 | 265.60 |
| All time | | 274.50 | 171.35 | |
| 1 Day | 5 Day | 20 Day | 50 Day |
| -3.50% | -0.50% | 8.50% | 0.00% |
Trading range:
| TradingRange | Highest
Close | Lowest
Close | Highest
High | Lowest
Low |
| 5 days | 267.85 | 248.35 | 274.50 | 245.85 |
| 10 days | 267.85 | 231.90 | 274.50 | 223.00 |
| 20 days | 267.85 | 217.55 | 274.50 | 205.00 |
Trend analysis :
| Trend | First Signal | Price | Reversal | P SAR |
| BBB | 03-04-2024 | 228.85 | 205.00 | 234.31 |
| ATR (20d) | Williams R | RSI (5d) | RSI (14d) | Vol | Av Vol (20d) |
| 14.21 | 62 | 43 | 59 | 203000 | 654000
|
Fibonacci price projections:
| 0% | 61.8% | 100% | 161.8% | 261.8% |
| Up | 205.00 | 247.95 | 274.50 | 317.45 | 386.95 |
| Dn | 274.50 | 231.55 | 205.00 | 162.05 | 92.55 |
Intraday pivot levels:
| Sup 2 | Sup 1 | Pivot | Res 1 | Res 2 |
| 235.35 | 241.80 | 252.30 | 258.75 | 269.25 |
Weekly pivot levels:
| Sup 2 | Sup 1 | Pivot | Res 1 | Res 2 |
| 237.95 | 248.10 | 261.30 | 271.45 | 284.65 |
Monthly pivot levels:
| Sup 2 | Sup 1 | Pivot | Res 1 | Res 2 |
| 135.20 | 200.35 | 237.45 | 302.65 | 339.70 |
Moving averages (simple):
| 5 Day | 20 Day | 50 Day | 200 Day |
| 260 | 240 | |
|
Other levels:
| 52 Week Hi - Lo | Last Mnth Hi - Lo | Swing Hi - Lo | B Band Hi - Lo |
| 274.50 - 171.35 | 274.50 - 172.25 | 274.50 - 205.00 | 273.55 - 205.55 |
|
Charts...
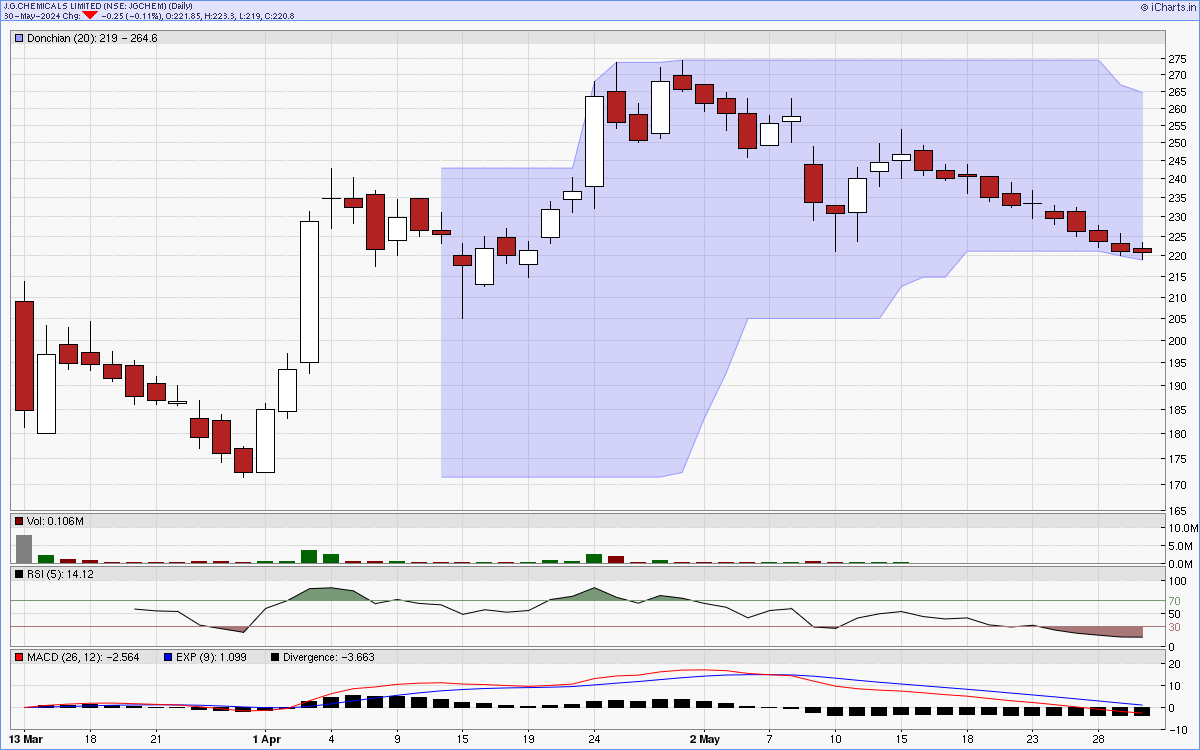
Six months candlestick chart
Charts courtsey: iCharts.in
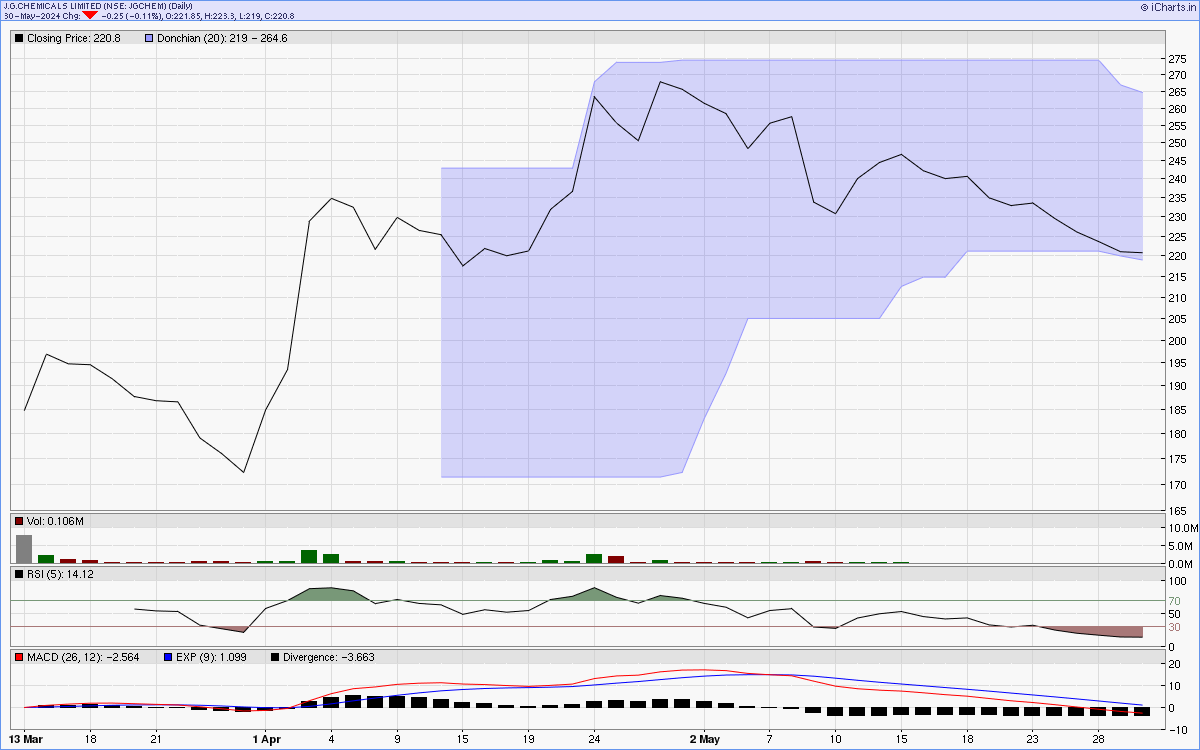
One year line chart
Two years weekly chart
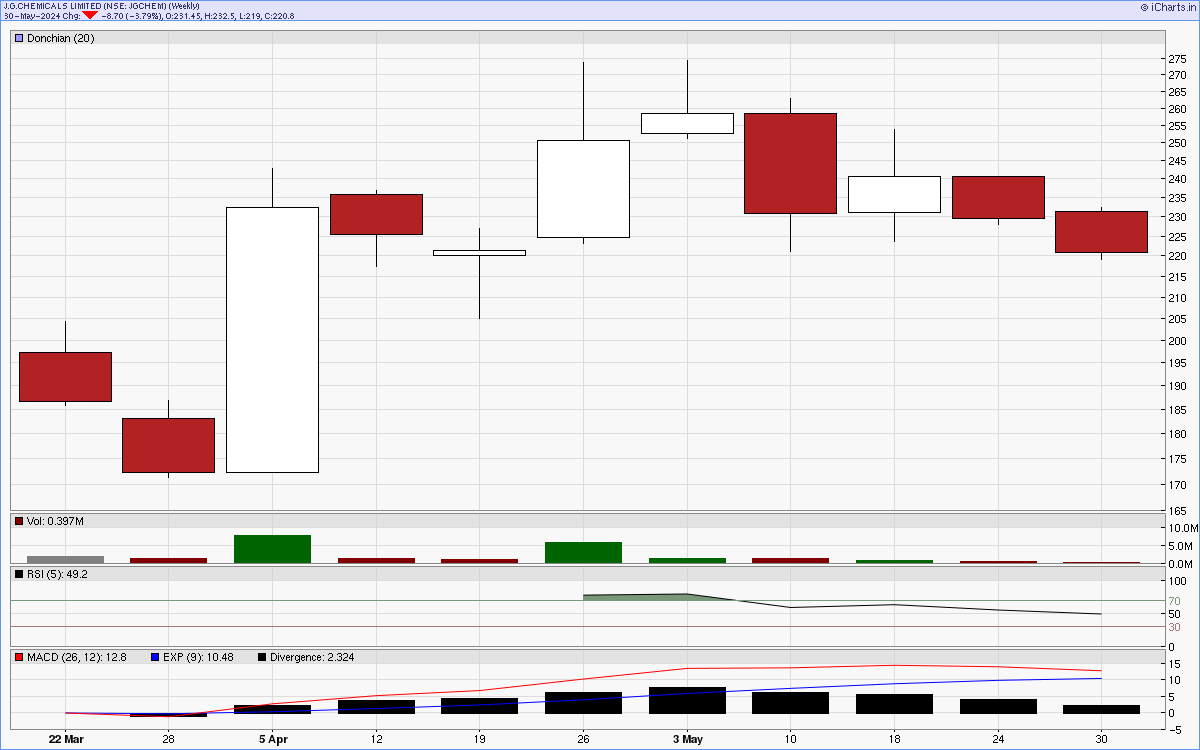
Charts courtsey: iCharts.in