Price / Percentage change:
| Open | High | Low | Close |
| Latest | 895.85 | 903.70 | 866.00 | 874.20 |
| Prev day | 883.00 | 894.60 | 883.00 | 890.35 |
| Last week | 867.10 | 914.00 | 848.55 | 887.25 |
| Last month | 838.00 | 914.00 | 833.20 | 882.20 |
| All time | | 914.00 | 16.01 | |
| 1 Day | 5 Day | 20 Day | 50 Day |
| -1.50% | -3.00% | -0.50% | 7.50% |
Trading range:
| TradingRange | Highest
Close | Lowest
Close | Highest
High | Lowest
Low |
| 5 days | 895.75 | 874.20 | 914.00 | 866.00 |
| 10 days | 905.80 | 851.35 | 914.00 | 833.20 |
| 20 days | 905.80 | 844.80 | 914.00 | 833.20 |
Trend analysis :
| Trend | First Signal | Price | Reversal | P SAR |
| BBB | 01-04-2024 | 871.95 | 833.20 | 854.09 |
| ATR (20d) | Williams R | RSI (5d) | RSI (14d) | Vol | Av Vol (20d) |
| 23.19 | 51 | 45 | 53 | 3672000 | 2727000
|
Fibonacci price projections:
| 0% | 61.8% | 100% | 161.8% | 261.8% |
| Up | 833.20 | 869.20 | 891.45 | 927.45 | 985.70 |
| Dn | 891.45 | 855.45 | 833.20 | 797.20 | 738.95 |
Intraday pivot levels:
| Sup 2 | Sup 1 | Pivot | Res 1 | Res 2 |
| 843.60 | 858.85 | 881.30 | 896.60 | 919.00 |
Weekly pivot levels:
| Sup 2 | Sup 1 | Pivot | Res 1 | Res 2 |
| 817.80 | 852.50 | 883.25 | 917.95 | 948.70 |
Monthly pivot levels:
| Sup 2 | Sup 1 | Pivot | Res 1 | Res 2 |
| 795.65 | 838.90 | 876.45 | 919.70 | 957.25 |
Moving averages (simple):
| 5 Day | 20 Day | 50 Day | 200 Day |
| 886 | 871 | 840 |
811 |
Other levels:
| 52 Week Hi - Lo | Last Mnth Hi - Lo | Swing Hi - Lo | B Band Hi - Lo |
| 914.00 - 681.05 | 914.00 - 833.20 | 891.45 - 833.20 | 904.28 - 838.69 |
|
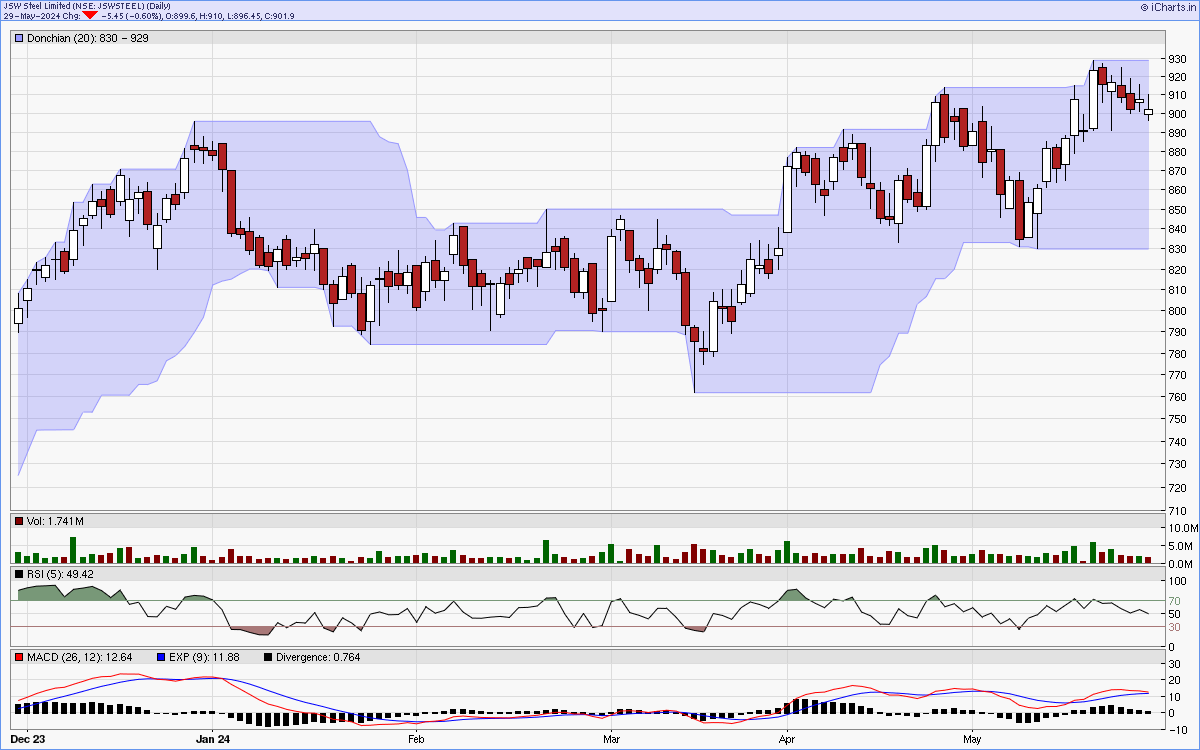
Charts...
Six months candlestick chart
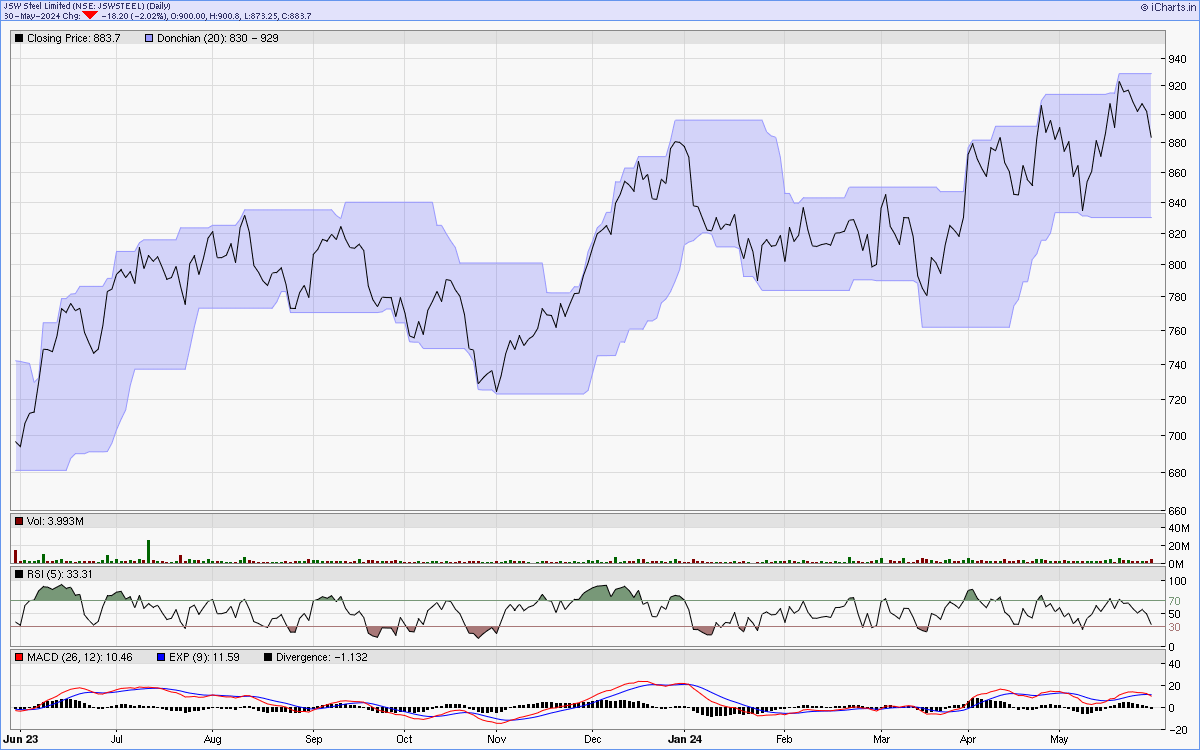
Charts courtsey: iCharts.in
One year line chart
Two years weekly chart
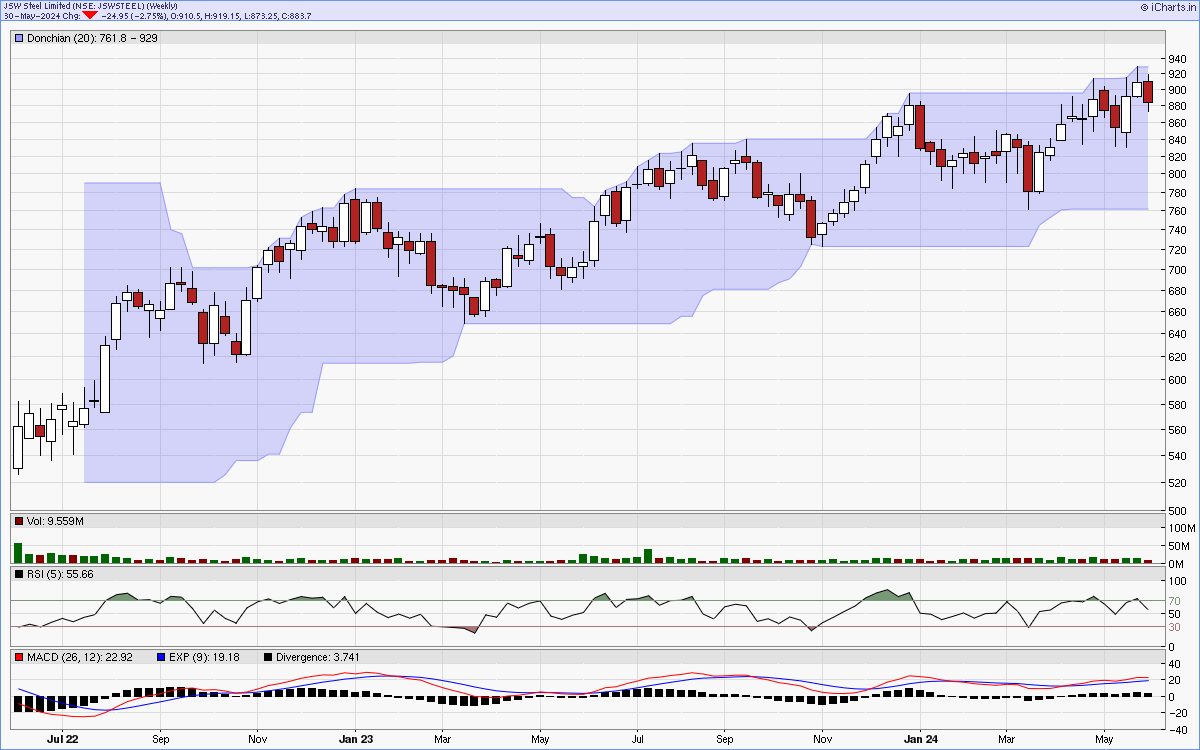
Charts courtsey: iCharts.in