Price / Percentage change:
| Open | High | Low | Close |
| Latest | 469.90 | 477.95 | 446.30 | 452.20 |
| Prev day | 476.65 | 481.60 | 460.65 | 467.20 |
| Last week | 465.00 | 490.00 | 463.00 | 474.85 |
| Last month | 470.00 | 502.00 | 441.00 | 480.30 |
| All time | | 534.00 | 37.00 | |
| 1 Day | 5 Day | 20 Day | 50 Day |
| -3.00% | -3.00% | -1.50% | -9.00% |
Trading range:
| TradingRange | Highest
Close | Lowest
Close | Highest
High | Lowest
Low |
| 5 days | 484.60 | 452.20 | 490.00 | 446.30 |
| 10 days | 484.60 | 452.20 | 490.00 | 446.30 |
| 20 days | 484.60 | 452.20 | 490.00 | 446.30 |
Trend analysis :
| Trend | First Signal | Price | Reversal | P SAR |
| SSS | 12-09-2023 | 455.90 | 490.00 | 489.41 |
| ATR (20d) | Williams R | RSI (5d) | RSI (14d) | Vol | Av Vol (20d) |
| 15.60 | 14 | 24 | 38 | 221000 | 120000
|
Fibonacci price projections:
| 0% | 61.8% | 100% | 161.8% | 261.8% |
| Up | 455.50 | 473.73 | 485.00 | 503.23 | 532.73 |
| Dn | 485.00 | 466.77 | 455.50 | 437.27 | 407.77 |
Intraday pivot levels:
| Sup 2 | Sup 1 | Pivot | Res 1 | Res 2 |
| 427.15 | 439.65 | 458.80 | 471.30 | 490.45 |
Weekly pivot levels:
| Sup 2 | Sup 1 | Pivot | Res 1 | Res 2 |
| 448.95 | 461.90 | 475.95 | 488.90 | 502.95 |
Monthly pivot levels:
| Sup 2 | Sup 1 | Pivot | Res 1 | Res 2 |
| 413.40 | 446.80 | 474.40 | 507.80 | 535.40 |
Moving averages (simple):
| 5 Day | 20 Day | 50 Day | 200 Day |
| 472 | 470 | 473 |
447 |
Other levels:
| 52 Week Hi - Lo | Last Mnth Hi - Lo | Swing Hi - Lo | B Band Hi - Lo |
| 534.00 - 258.05 | 502.00 - 441.00 | 485.00 - 455.50 | 485.16 - 454.55 |
|
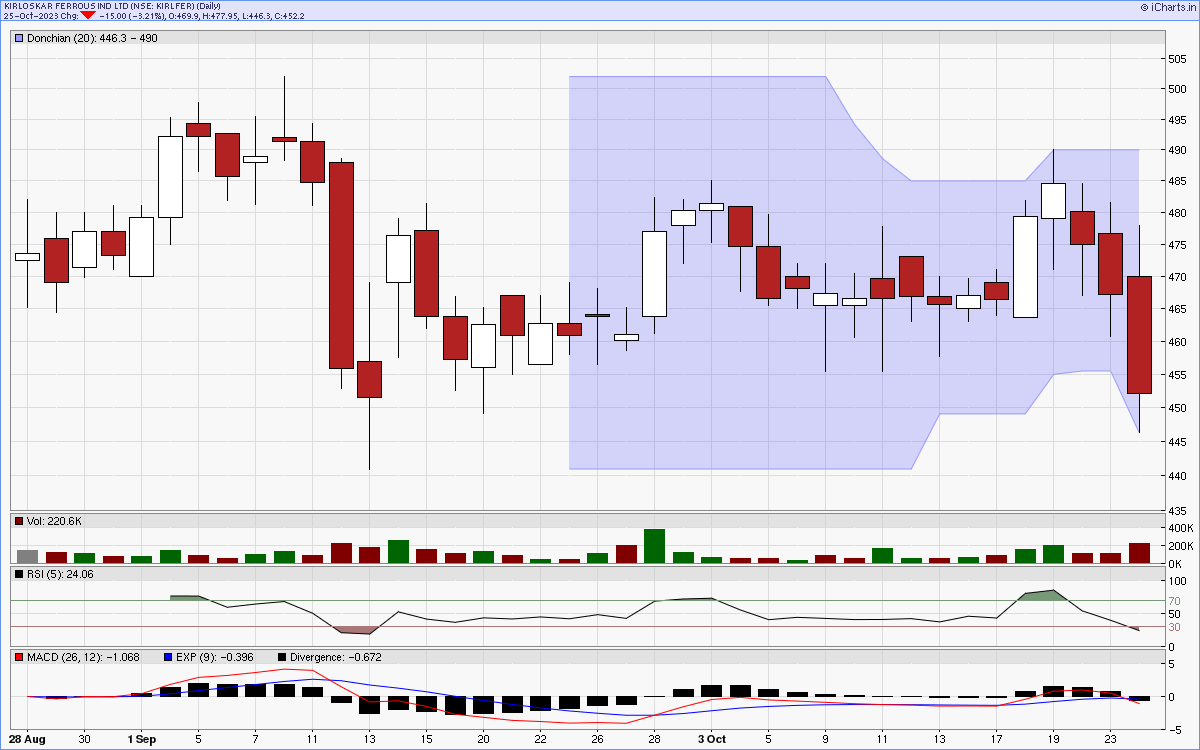
Charts...
Six months candlestick chart
Charts courtsey: iCharts.in
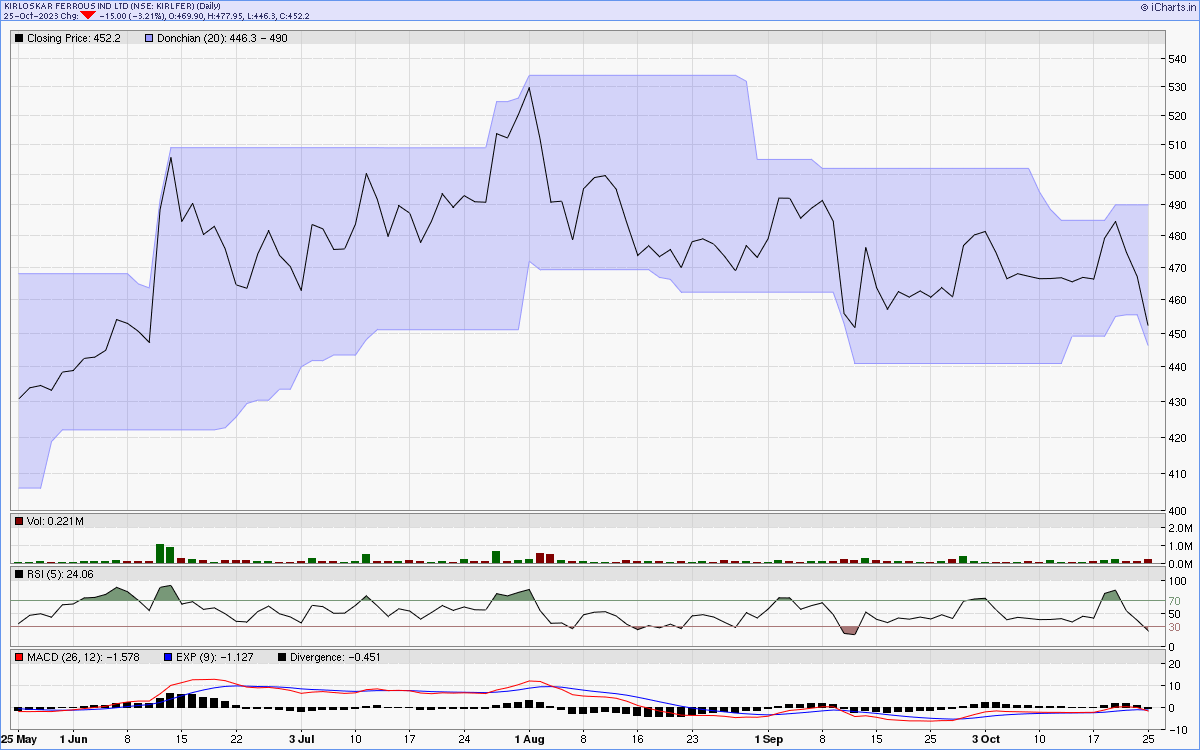
One year line chart
Two years weekly chart
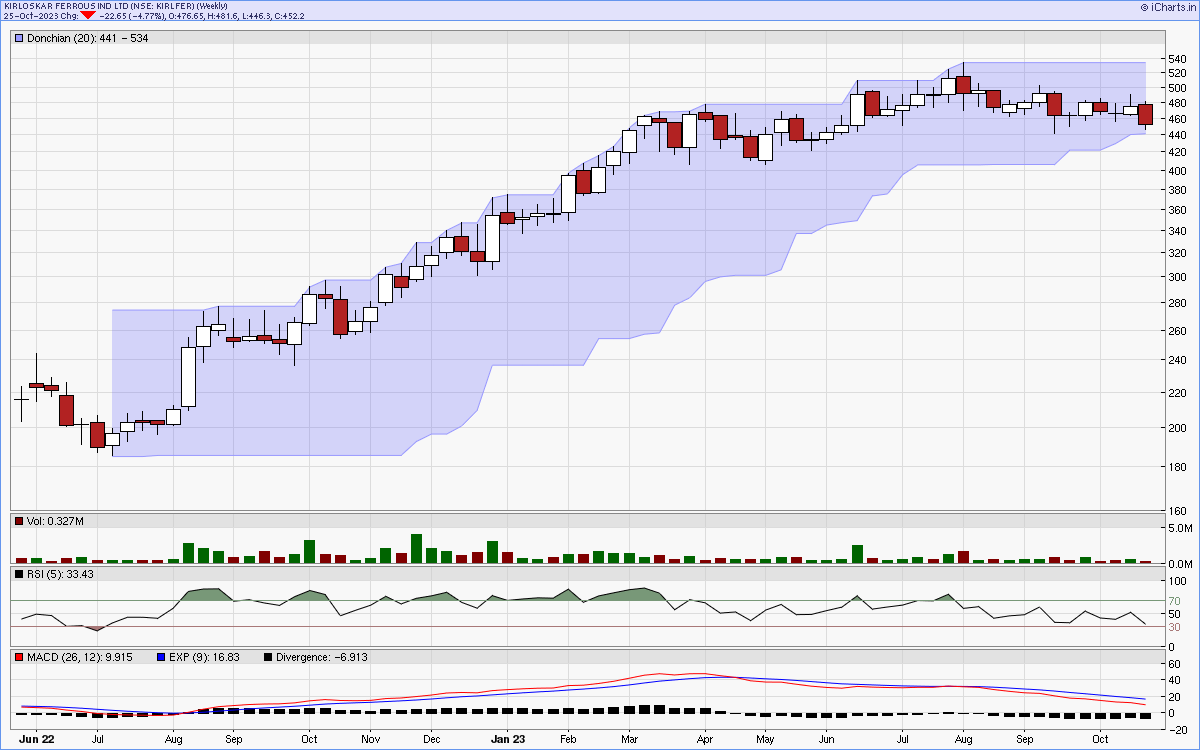
Charts courtsey: iCharts.in