Price / Percentage change:
| Open | High | Low | Close |
| Latest | 1362.85 | 1410.00 | 1347.00 | 1394.05 |
| Prev day | 1324.95 | 1374.95 | 1310.00 | 1359.40 |
| Last week | 1197.50 | 1353.80 | 1194.60 | 1299.15 |
| Last month | 1125.05 | 1353.80 | 1083.55 | 1312.75 |
| All time | | 1410.00 | 76.25 | |
| 1 Day | 5 Day | 20 Day | 50 Day |
| 2.50% | 4.00% | 26.50% | 54.50% |
Trading range:
| TradingRange | Highest
Close | Lowest
Close | Highest
High | Lowest
Low |
| 5 days | 1394.05 | 1299.15 | 1410.00 | 1285.80 |
| 10 days | 1394.05 | 1197.50 | 1410.00 | 1142.05 |
| 20 days | 1394.05 | 1140.00 | 1410.00 | 1083.55 |
Trend analysis :
| Trend | First Signal | Price | Reversal | P SAR |
| BBB | 07-02-2024 | 967.40 | 1083.55 | 1290.05 |
| ATR (20d) | Williams R | RSI (5d) | RSI (14d) | Vol | Av Vol (20d) |
| 62.55 | 95 | 84 | 72 | 256000 | 126000
|
Fibonacci price projections:
| 0% | 61.8% | 100% | 161.8% | 261.8% |
| Up | 1083.55 | 1092.45 | 1097.95 | 1106.85 | 1121.25 |
| Dn | 1097.95 | 1089.05 | 1083.55 | 1074.65 | 1060.25 |
Intraday pivot levels:
| Sup 2 | Sup 1 | Pivot | Res 1 | Res 2 |
| 1320.65 | 1357.30 | 1383.65 | 1420.30 | 1446.65 |
Weekly pivot levels:
| Sup 2 | Sup 1 | Pivot | Res 1 | Res 2 |
| 1123.30 | 1211.20 | 1282.50 | 1370.40 | 1441.70 |
Monthly pivot levels:
| Sup 2 | Sup 1 | Pivot | Res 1 | Res 2 |
| 979.75 | 1146.20 | 1250.00 | 1416.45 | 1520.25 |
Moving averages (simple):
| 5 Day | 20 Day | 50 Day | 200 Day |
| 1333 | 1238 | 1103 |
932 |
Other levels:
| 52 Week Hi - Lo | Last Mnth Hi - Lo | Swing Hi - Lo | B Band Hi - Lo |
| 1410.00 - 415.00 | 1353.80 - 1083.55 | 1097.95 - 1083.55 | 1391.43 - 1085.09 |
|
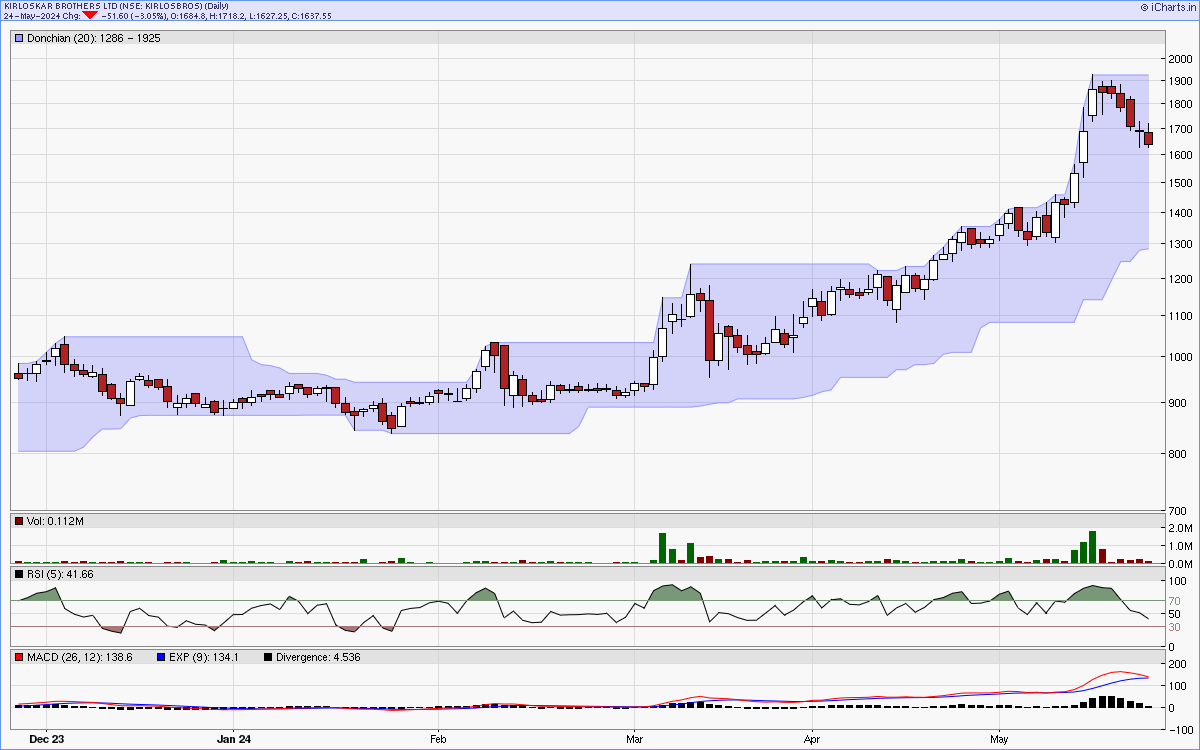
Charts...
Six months candlestick chart
Charts courtsey: iCharts.in
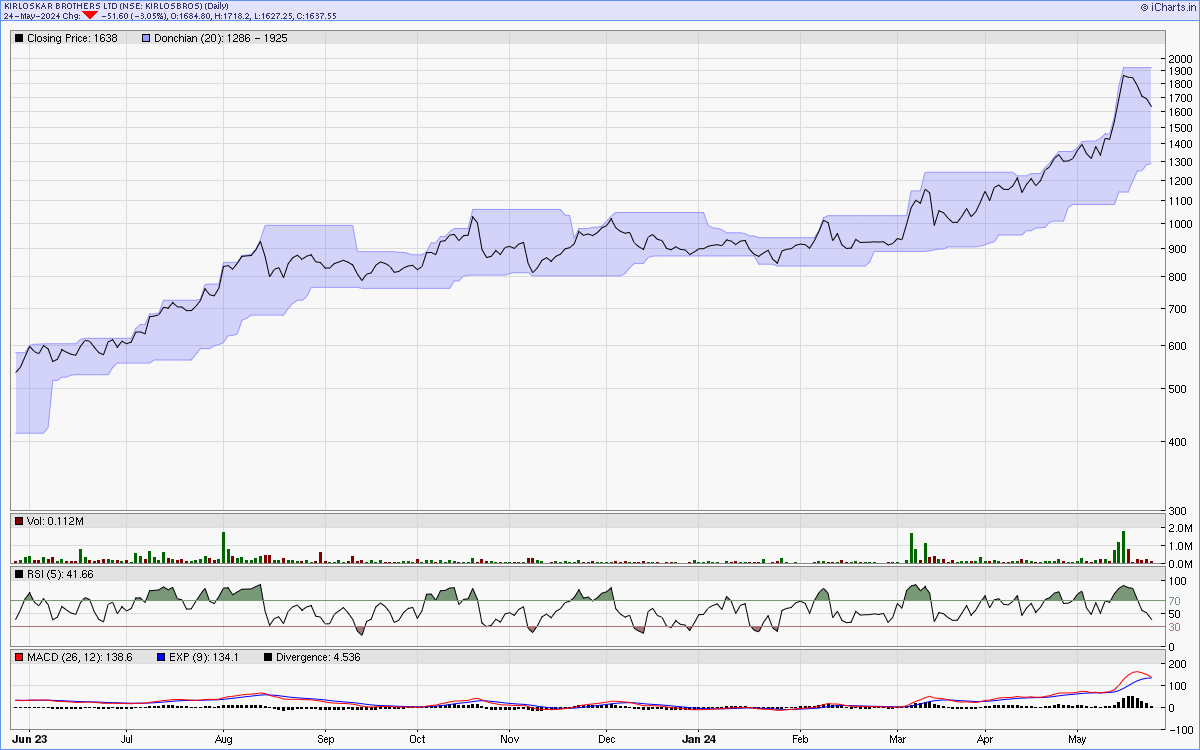
One year line chart
Two years weekly chart
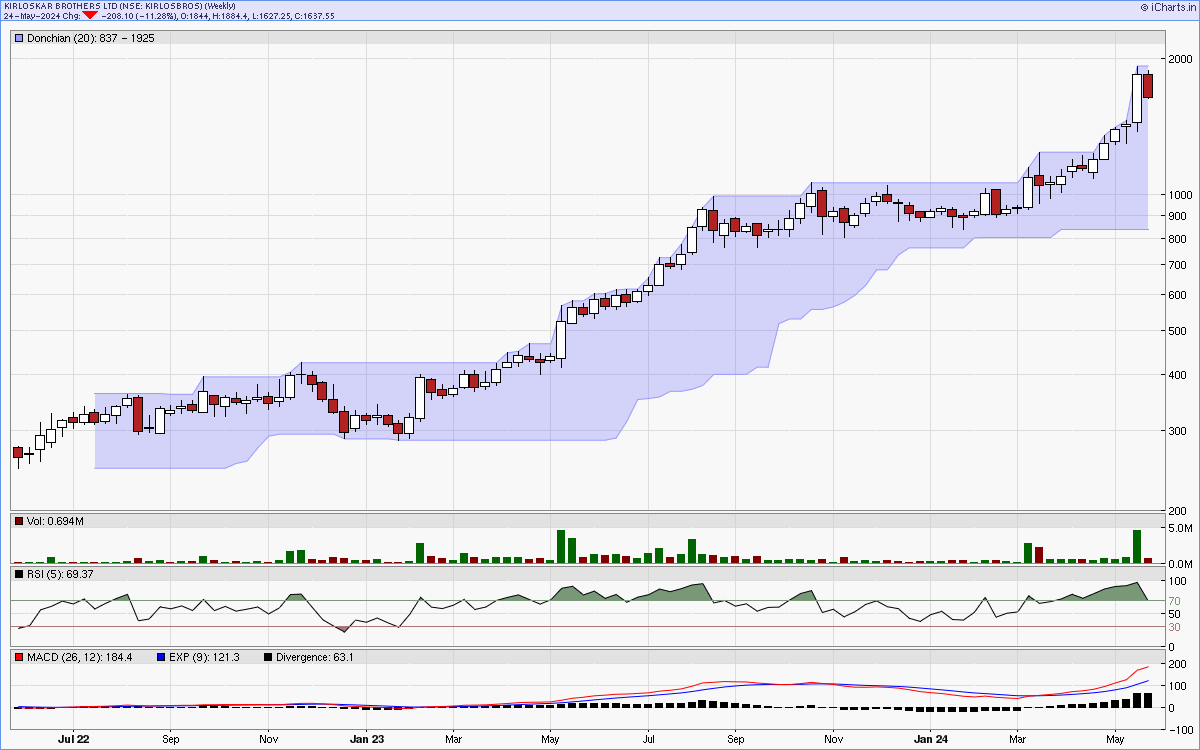
Charts courtsey: iCharts.in