Price / Percentage change:
| Open | High | Low | Close |
| Latest | 1079.05 | 1094.00 | 1041.00 | 1053.70 |
| Prev day | 1150.00 | 1150.00 | 1054.00 | 1077.25 |
| Last week | 1100.00 | 1150.45 | 1025.05 | 1077.25 |
| Last month | 711.70 | 1100.00 | 677.95 | 1045.90 |
| All time | | 1150.45 | 541.05 | |
| 1 Day | 5 Day | 20 Day | 50 Day |
| -2.00% | -1.00% | 52.00% | 45.00% |
Trading range:
| TradingRange | Highest
Close | Lowest
Close | Highest
High | Lowest
Low |
| 5 days | 1150.45 | 1044.35 | 1150.45 | 1025.05 |
| 10 days | 1150.45 | 773.25 | 1150.45 | 746.30 |
| 20 days | 1150.45 | 684.50 | 1150.45 | 677.95 |
Trend analysis :
| Trend | First Signal | Price | Reversal | P SAR |
| BBB | 16-04-2024 | 742.50 | 677.95 | 991.39 |
| ATR (20d) | Williams R | RSI (5d) | RSI (14d) | Vol | Av Vol (20d) |
| 48.59 | 79 | 63 | 72 | 159000 | 506000
|
Fibonacci price projections:
| 0% | 61.8% | 100% | 161.8% | 261.8% |
| Up | 623.25 | 949.06 | 1150.45 | 1476.26 | 2003.46 |
| Dn | 1150.45 | 824.64 | 623.25 | 297.44 | -229.76 |
Intraday pivot levels:
| Sup 2 | Sup 1 | Pivot | Res 1 | Res 2 |
| 1009.85 | 1031.65 | 1062.85 | 1084.65 | 1115.85 |
Weekly pivot levels:
| Sup 2 | Sup 1 | Pivot | Res 1 | Res 2 |
| 958.85 | 1018.05 | 1084.25 | 1143.45 | 1209.65 |
Monthly pivot levels:
| Sup 2 | Sup 1 | Pivot | Res 1 | Res 2 |
| 519.20 | 782.50 | 941.25 | 1204.55 | 1363.30 |
Moving averages (simple):
| 5 Day | 20 Day | 50 Day | 200 Day |
| 1074 | 844 | 754 |
654 |
Other levels:
| 52 Week Hi - Lo | Last Mnth Hi - Lo | Swing Hi - Lo | B Band Hi - Lo |
| 1150.45 - 541.05 | 1100.00 - 677.95 | 1150.45 - 623.25 | 1161.70 - 525.48 |
|
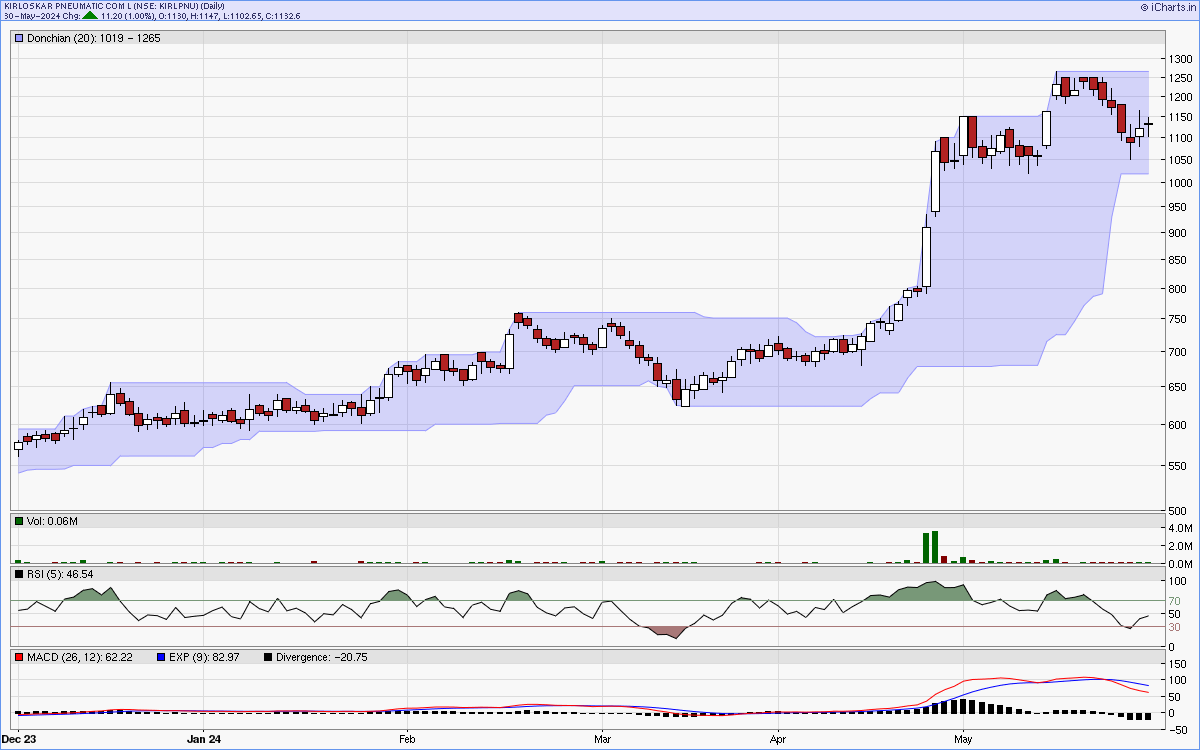
Charts...
Six months candlestick chart
Charts courtsey: iCharts.in
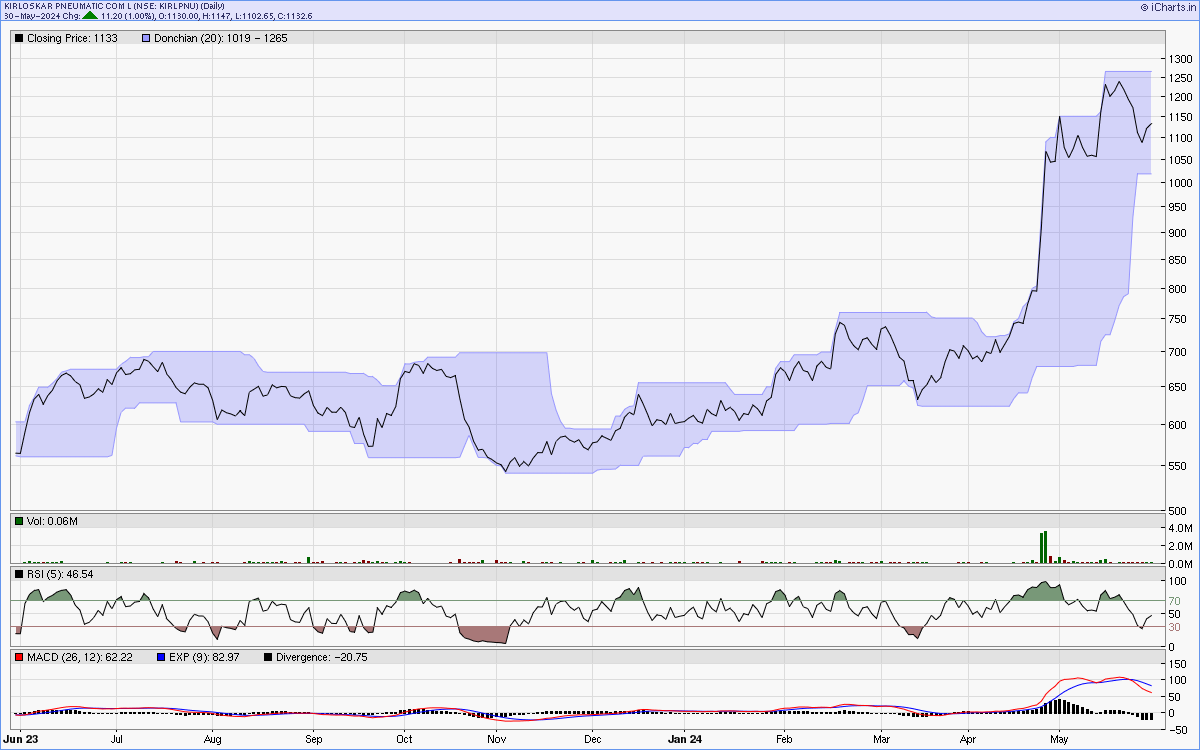
One year line chart
Two years weekly chart
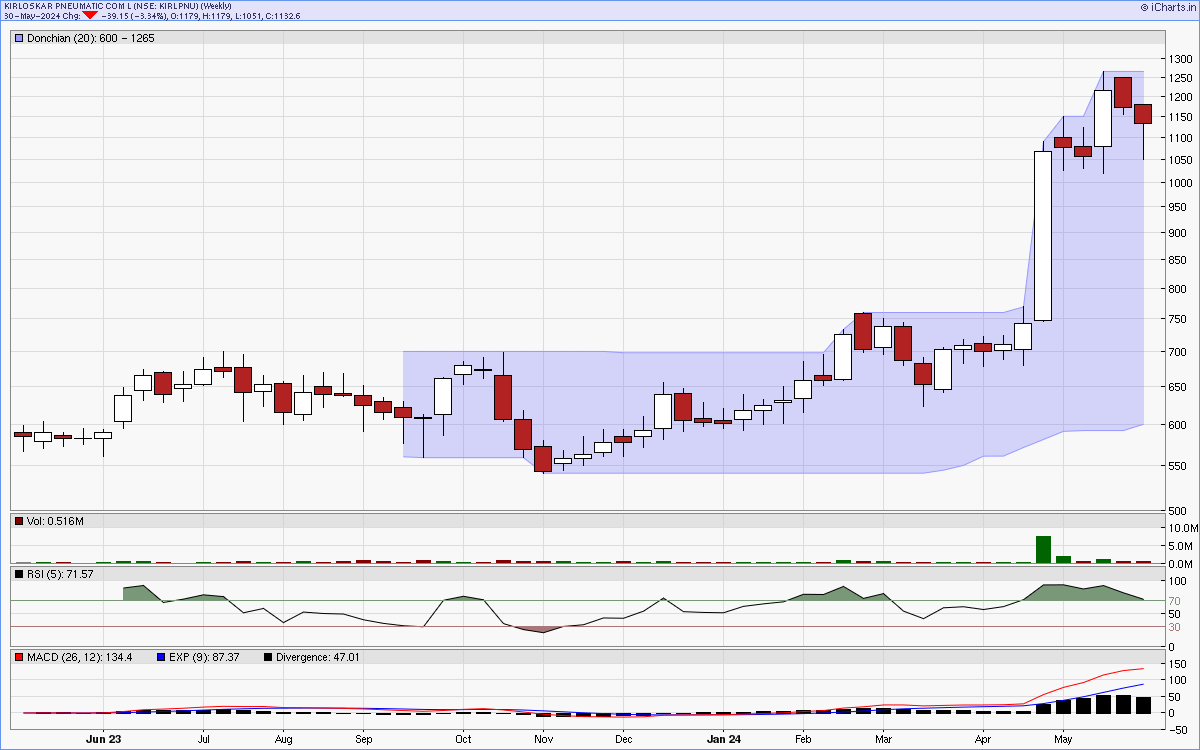
Charts courtsey: iCharts.in