Price / Percentage change:
| Open | High | Low | Close |
| Latest | 4693.10 | 4717.20 | 4500.00 | 4531.85 |
| Prev day | 4650.00 | 4727.65 | 4580.00 | 4650.35 |
| Last week | 4750.00 | 4772.10 | 4478.00 | 4650.35 |
| Last month | 3882.65 | 5190.00 | 3835.00 | 4512.00 |
| All time | | 5190.00 | 135.20 | |
| 1 Day | 5 Day | 20 Day | 50 Day |
| -2.50% | -3.00% | 15.00% | 11.00% |
Trading range:
| TradingRange | Highest
Close | Lowest
Close | Highest
High | Lowest
Low |
| 5 days | 4650.35 | 4512.00 | 4772.10 | 4478.00 |
| 10 days | 4931.70 | 4512.00 | 5190.00 | 4478.00 |
| 20 days | 4931.70 | 3917.95 | 5190.00 | 3835.00 |
Trend analysis :
| Trend | First Signal | Price | Reversal | P SAR |
| BBB | 06-02-2024 | 3812.50 | 3835.00 | 5082.38 |
| ATR (20d) | Williams R | RSI (5d) | RSI (14d) | Vol | Av Vol (20d) |
| 188.31 | 33 | 43 | 57 | 25000 | 80000
|
Fibonacci price projections:
| 0% | 61.8% | 100% | 161.8% | 261.8% |
| Up | 3317.55 | 4474.72 | 5190.00 | 6347.17 | 8219.62 |
| Dn | 5190.00 | 4032.83 | 3317.55 | 2160.38 | 287.93 |
Intraday pivot levels:
| Sup 2 | Sup 1 | Pivot | Res 1 | Res 2 |
| 4365.80 | 4448.80 | 4583.00 | 4666.00 | 4800.20 |
Weekly pivot levels:
| Sup 2 | Sup 1 | Pivot | Res 1 | Res 2 |
| 4339.30 | 4494.75 | 4633.45 | 4788.90 | 4927.55 |
Monthly pivot levels:
| Sup 2 | Sup 1 | Pivot | Res 1 | Res 2 |
| 3157.30 | 3834.60 | 4512.30 | 5189.60 | 5867.30 |
Moving averages (simple):
| 5 Day | 20 Day | 50 Day | 200 Day |
| 4582 | 4450 | 4060 |
3310 |
Other levels:
| 52 Week Hi - Lo | Last Mnth Hi - Lo | Swing Hi - Lo | B Band Hi - Lo |
| 5190.00 - 2013.35 | 5190.00 - 3835.00 | 5190.00 - 3317.55 | 4993.48 - 3907.34 |
|
Charts...
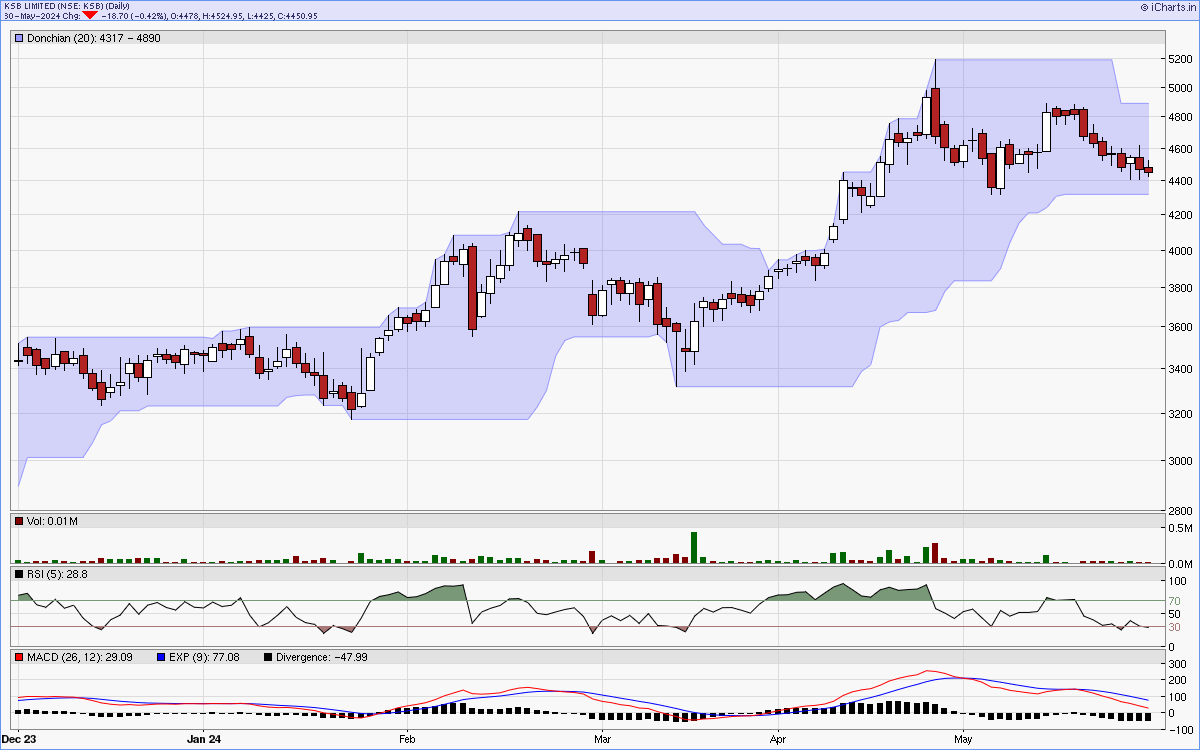
Six months candlestick chart
Charts courtsey: iCharts.in
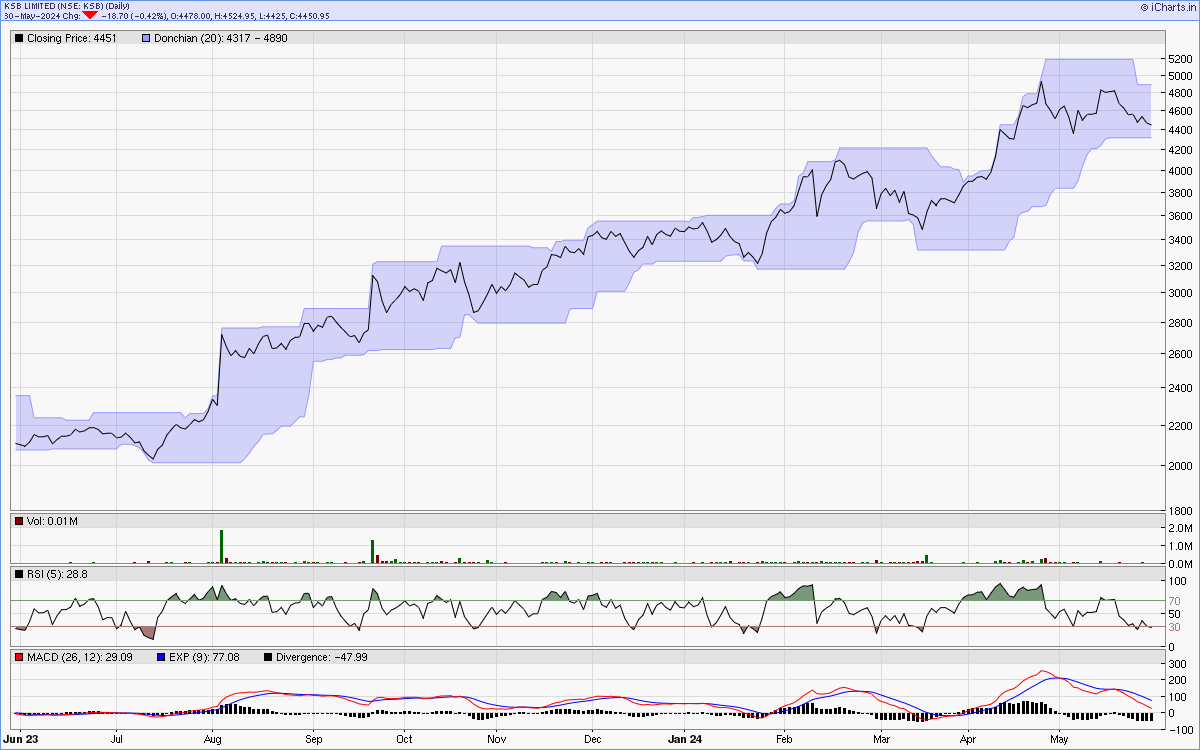
One year line chart
Two years weekly chart
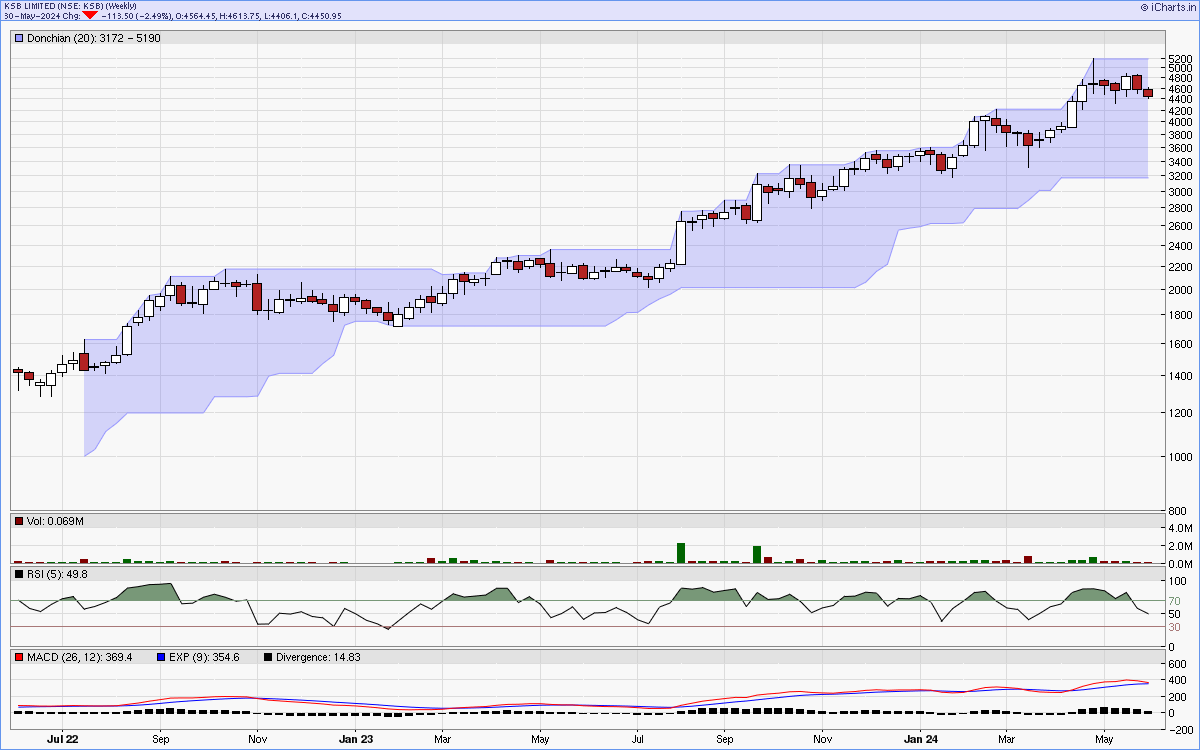
Charts courtsey: iCharts.in