Price / Percentage change:
| Open | High | Low | Close |
| Latest | 868.25 | 873.05 | 835.25 | 849.50 |
| Prev day | 867.10 | 886.95 | 854.90 | 868.20 |
| Last week | 758.65 | 888.00 | 746.25 | 879.85 |
| Last month | 626.50 | 888.60 | 619.70 | 868.20 |
| All time | | 1075.50 | 23.20 | |
| 1 Day | 5 Day | 20 Day | 50 Day |
| -2.00% | 7.50% | 30.50% | 28.00% |
Trading range:
| TradingRange | Highest
Close | Lowest
Close | Highest
High | Lowest
Low |
| 5 days | 879.85 | 841.10 | 888.60 | 782.00 |
| 10 days | 879.85 | 685.05 | 888.60 | 675.05 |
| 20 days | 879.85 | 639.05 | 888.60 | 632.00 |
Trend analysis :
| Trend | First Signal | Price | Reversal | P SAR |
| BBB | 19-04-2024 | 756.80 | 632.00 | 810.52 |
| ATR (20d) | Williams R | RSI (5d) | RSI (14d) | Vol | Av Vol (20d) |
| 30.83 | 83 | 68 | 73 | 128000 | 360000
|
Fibonacci price projections:
| 0% | 61.8% | 100% | 161.8% | 261.8% |
| Up | 618.50 | 674.92 | 709.80 | 766.22 | 857.52 |
| Dn | 709.80 | 653.38 | 618.50 | 562.08 | 470.78 |
Intraday pivot levels:
| Sup 2 | Sup 1 | Pivot | Res 1 | Res 2 |
| 814.80 | 832.15 | 852.60 | 869.95 | 890.40 |
Weekly pivot levels:
| Sup 2 | Sup 1 | Pivot | Res 1 | Res 2 |
| 696.25 | 788.00 | 838.00 | 929.75 | 979.75 |
Monthly pivot levels:
| Sup 2 | Sup 1 | Pivot | Res 1 | Res 2 |
| 523.25 | 695.65 | 792.15 | 964.60 | 1061.05 |
Moving averages (simple):
| 5 Day | 20 Day | 50 Day | 200 Day |
| 863 | 739 | 693 |
629 |
Other levels:
| 52 Week Hi - Lo | Last Mnth Hi - Lo | Swing Hi - Lo | B Band Hi - Lo |
| 888.60 - 499.00 | 888.60 - 619.70 | 709.80 - 618.50 | 903.30 - 573.92 |
|
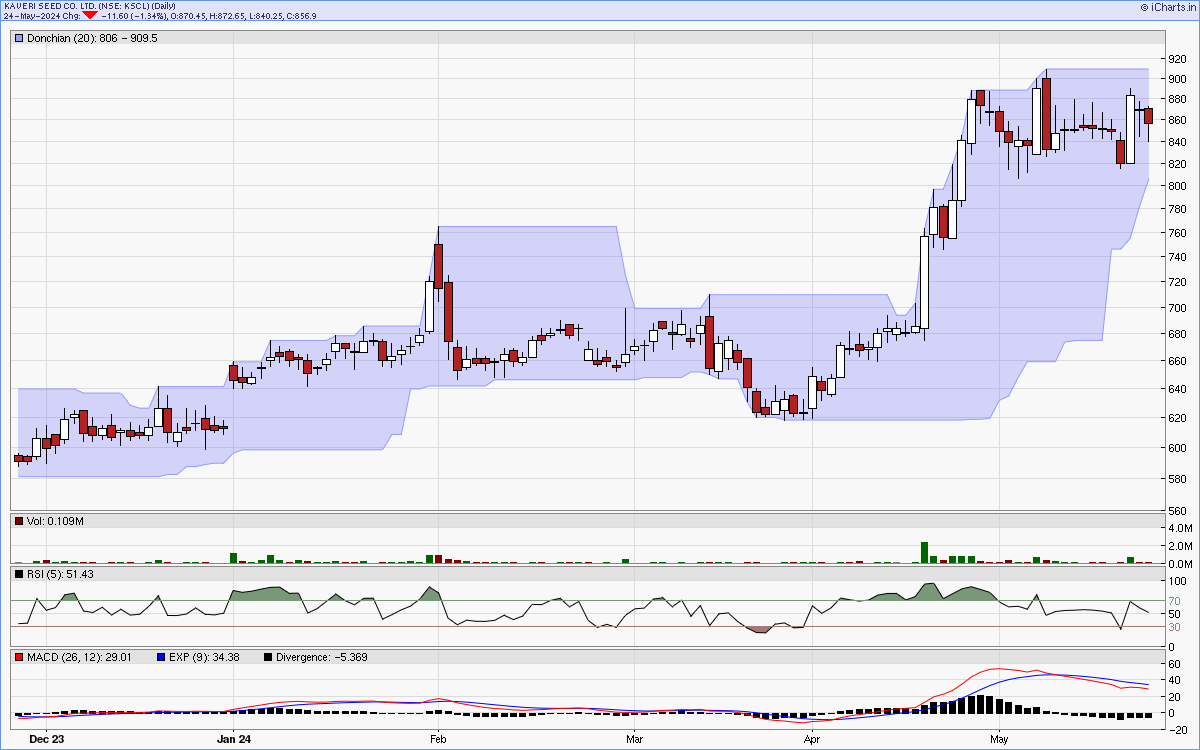
Charts...
Six months candlestick chart
Charts courtsey: iCharts.in
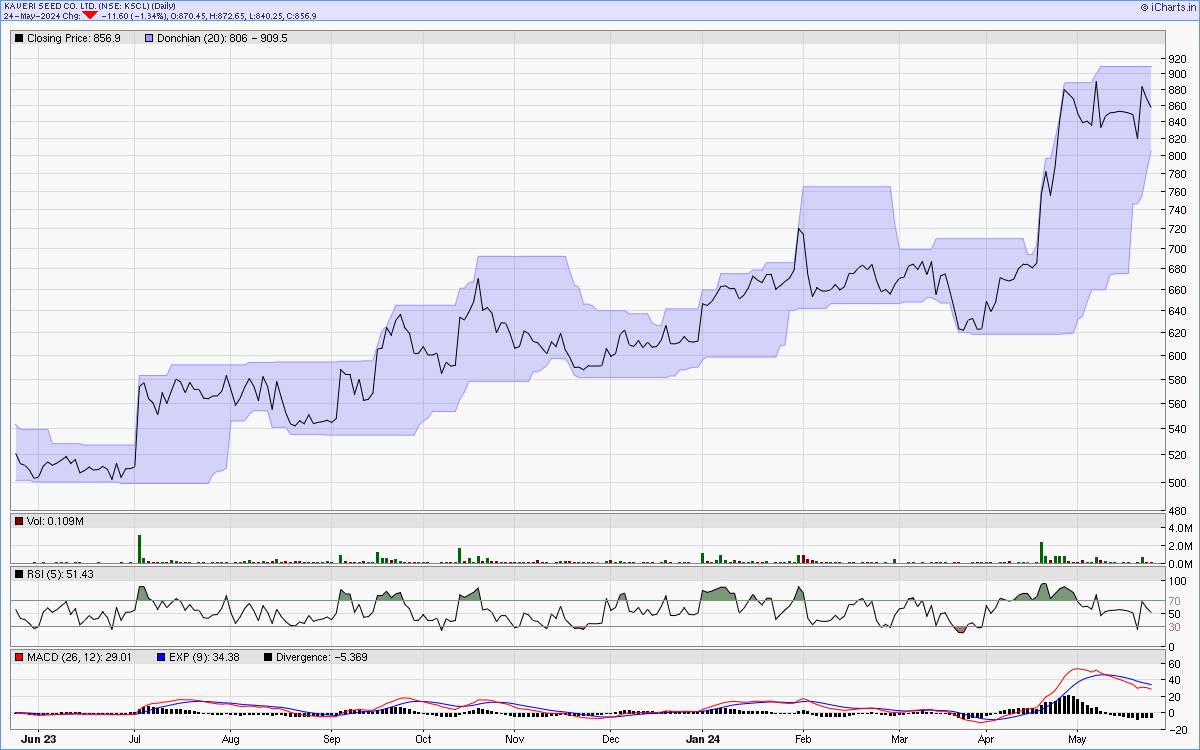
One year line chart
Two years weekly chart
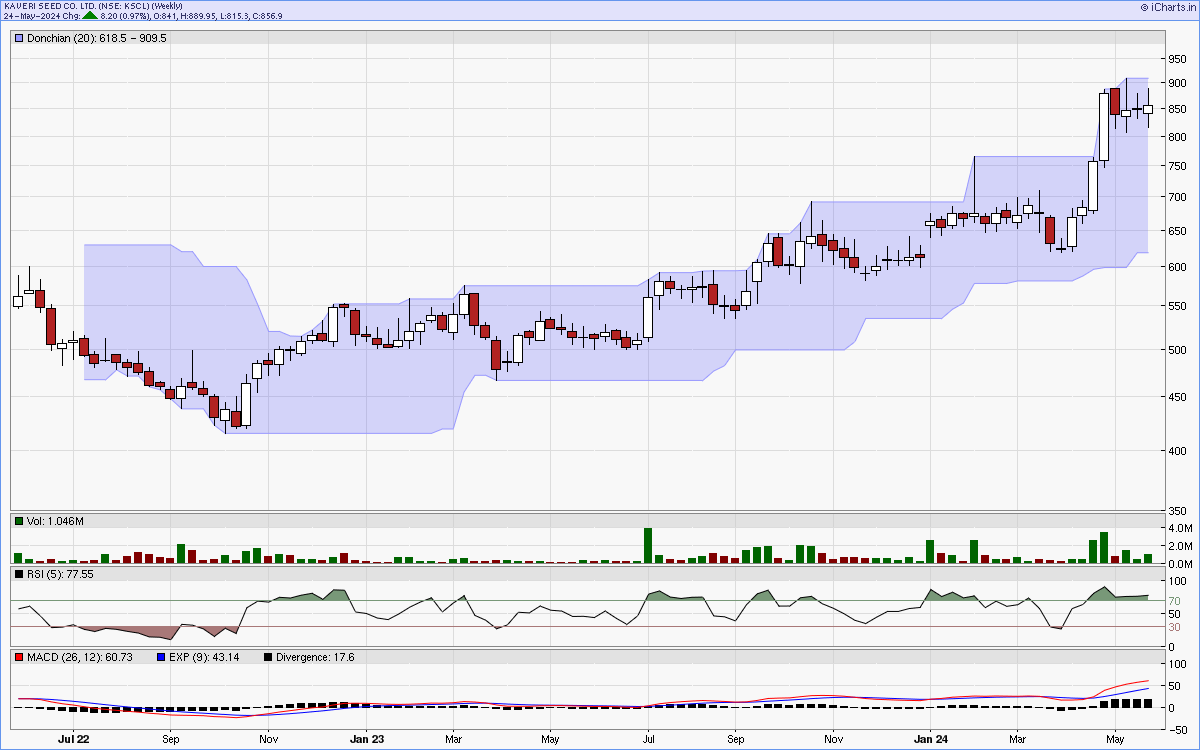
Charts courtsey: iCharts.in