Price / Percentage change:
| Open | High | Low | Close |
| Latest | 67.70 | 67.70 | 63.65 | 64.45 |
| Prev day | 69.05 | 69.95 | 67.50 | 68.70 |
| Last week | 55.20 | 68.10 | 55.10 | 63.70 |
| Last month | 49.40 | 73.20 | 48.55 | 68.55 |
| All time | | 73.20 | 39.60 | |
| 1 Day | 5 Day | 20 Day | 50 Day |
| -6.00% | 0.00% | 21.50% | 28.50% |
Trading range:
| TradingRange | Highest
Close | Lowest
Close | Highest
High | Lowest
Low |
| 5 days | 70.05 | 63.70 | 73.20 | 63.00 |
| 10 days | 70.05 | 54.30 | 73.20 | 53.05 |
| 20 days | 70.05 | 54.30 | 73.20 | 52.50 |
Trend analysis :
| Trend | First Signal | Price | Reversal | P SAR |
| BBB | 05-04-2024 | 57.10 | 52.50 | 60.40 |
| ATR (20d) | Williams R | RSI (5d) | RSI (14d) | Vol | Av Vol (20d) |
| 4.00 | 57 | 48 | 59 | 15465000 | 14167000
|
Fibonacci price projections:
| 0% | 61.8% | 100% | 161.8% | 261.8% |
| Up | 53.05 | 65.50 | 73.20 | 85.65 | 105.80 |
| Dn | 73.20 | 60.75 | 53.05 | 40.60 | 20.45 |
Intraday pivot levels:
| Sup 2 | Sup 1 | Pivot | Res 1 | Res 2 |
| 61.20 | 62.80 | 65.25 | 66.85 | 69.30 |
Weekly pivot levels:
| Sup 2 | Sup 1 | Pivot | Res 1 | Res 2 |
| 49.25 | 56.40 | 62.25 | 69.40 | 75.25 |
Monthly pivot levels:
| Sup 2 | Sup 1 | Pivot | Res 1 | Res 2 |
| 38.70 | 53.60 | 63.40 | 78.25 | 88.05 |
Moving averages (simple):
| 5 Day | 20 Day | 50 Day | 200 Day |
| 67 | 60 | 55 |
|
Other levels:
| 52 Week Hi - Lo | Last Mnth Hi - Lo | Swing Hi - Lo | B Band Hi - Lo |
| 73.20 - 39.60 | 73.20 - 48.55 | 73.20 - 53.05 | 70.96 - 49.54 |
|
Charts...
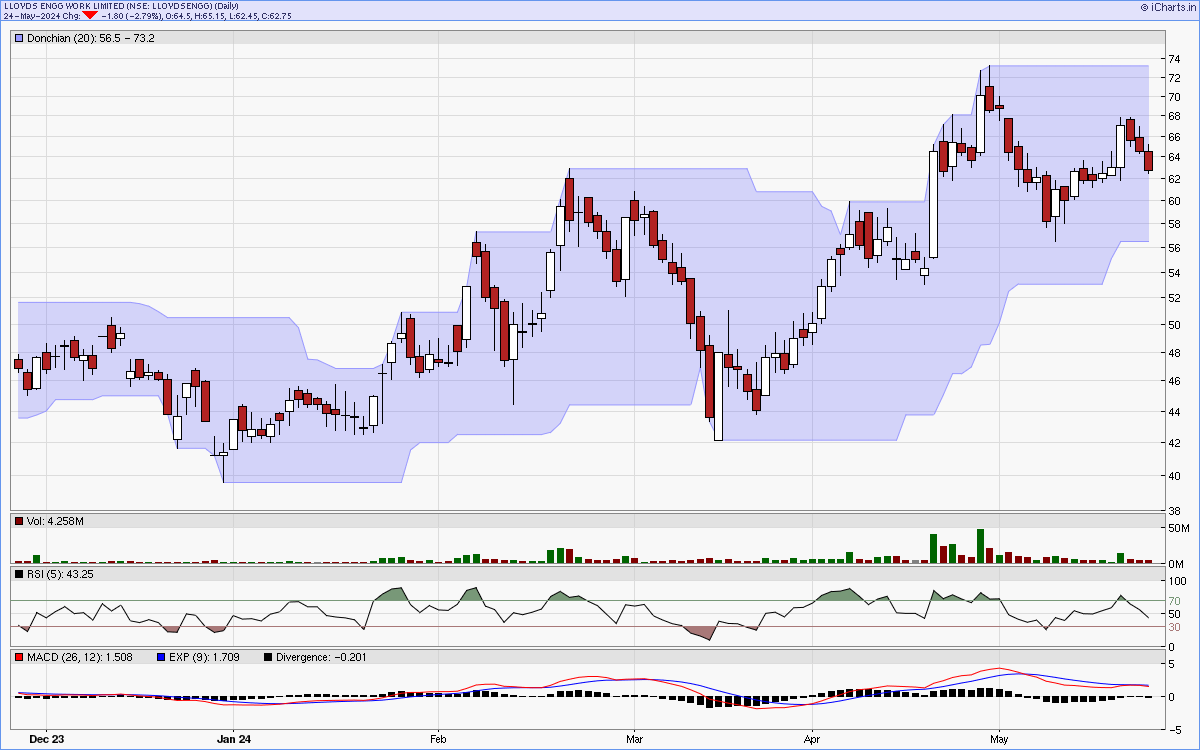
Six months candlestick chart
Charts courtsey: iCharts.in
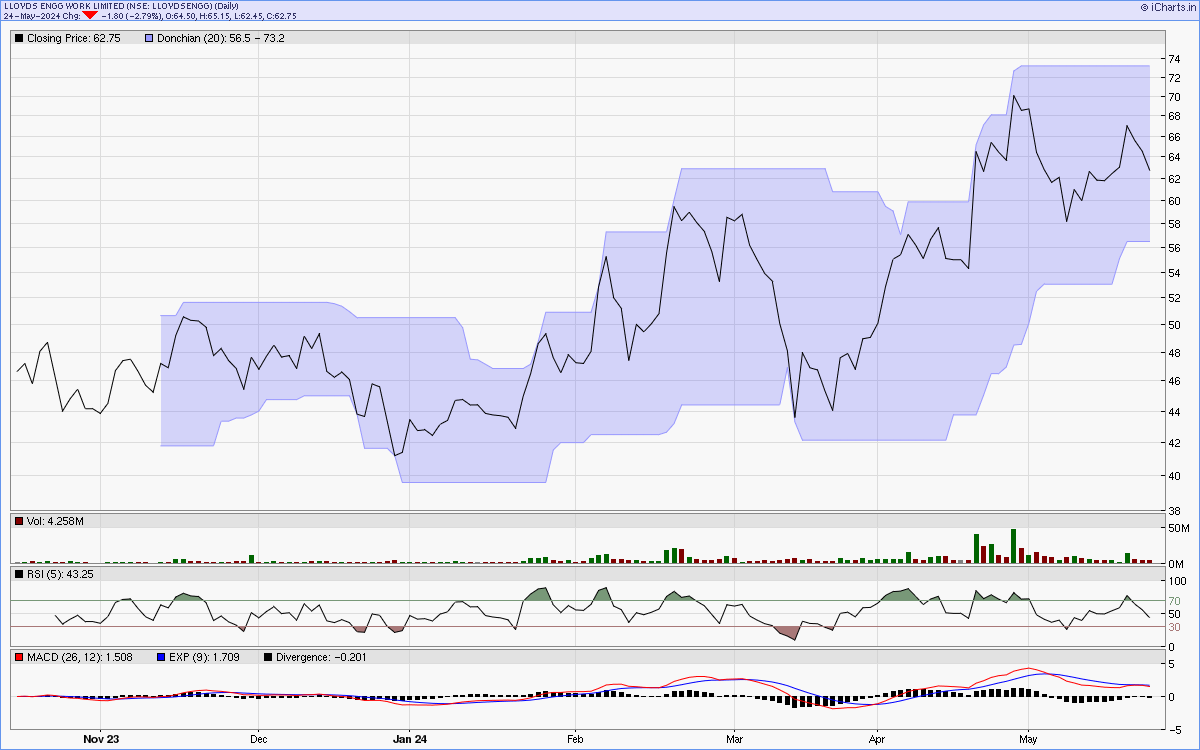
One year line chart
Two years weekly chart
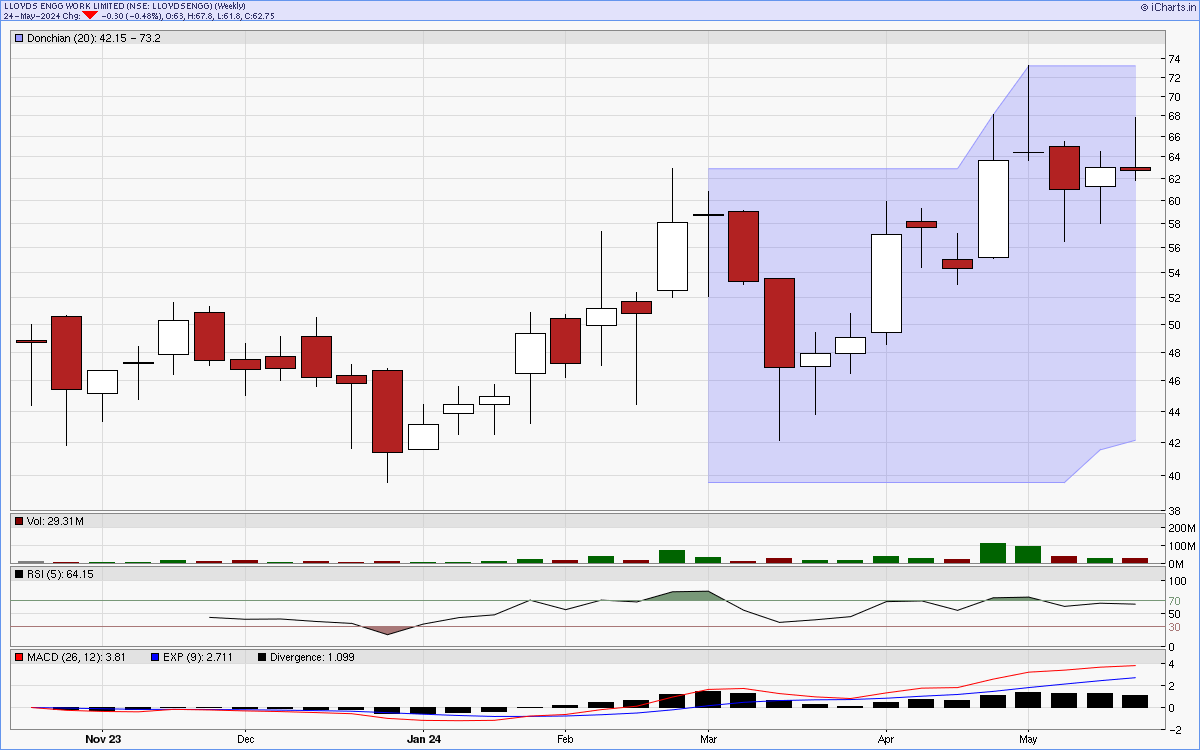
Charts courtsey: iCharts.in